C/2015 D3 PANSTARRS
more info
Comet C/2015 D3 was discovered on 19 February 2015 with Pan-STARRS 1 telescope (Haleakala), that is about months after its perihelion passage. Some prediscovery images of this comet were found: taken on 17 February 2015 by Space Surveillance Telescope (Atom Site) and 8 April 2013 by Siding Spring Survey. This comet was observed until 21 February 2020.
Comet had its closest approach to the Earth on 28 February 2016 (7.167 au), about 2 months before its perihelion passage.
Solutions given here are based on data spanning over 6.87 yr in a range of heliocentric distances: 10.46 au – 8.149 au (perihelion) – 11.49 au.
This Oort spike comet suffers slight planetary perturbations during its passage through the planetary system; however, these perturbations likely lead to escape the comet from the planetary zone on a hyperbolic orbit (see future barycentric orbits).
See also Królikowska and Dones 2023.
| solution description | ||
|---|---|---|
| number of observations | 151 | |
| data interval | 2016 05 11 – 2020 02 21 | |
| data arc selection | data generally limited to post-perihelion (POS) | |
| range of heliocentric distances | 8.15 au – 11.49au | |
| detectability of NG effects in the comet's motion | NG effects not determinable | |
| type of model of motion | GR - gravitational orbit | |
| data weighting | YES | |
| number of residuals | 298 | |
| RMS [arcseconds] | 0.42 | |
| orbit quality class | 1a | |
| next orbit statistics, both Galactic and stellar perturbations were taken into account | ||
|---|---|---|
| no. of returning VCs in the swarm | 0 | |
| no. of escaping VCs in the swarm | 5001 | |
| no. of hyperbolas among escaping VCs in the swarm | 5001 | * |
| next reciprocal semi-major axis [10-6 au-1] | -18.16 – -16.30 – -14.45 | |
| next perihelion distance [au] | 36.6 – 37.9 – 39.3 | |
| synchronous stop epoch [Myr] | 2.42 | S |
| percentage of VCs with qnext > 20 | 100 | |
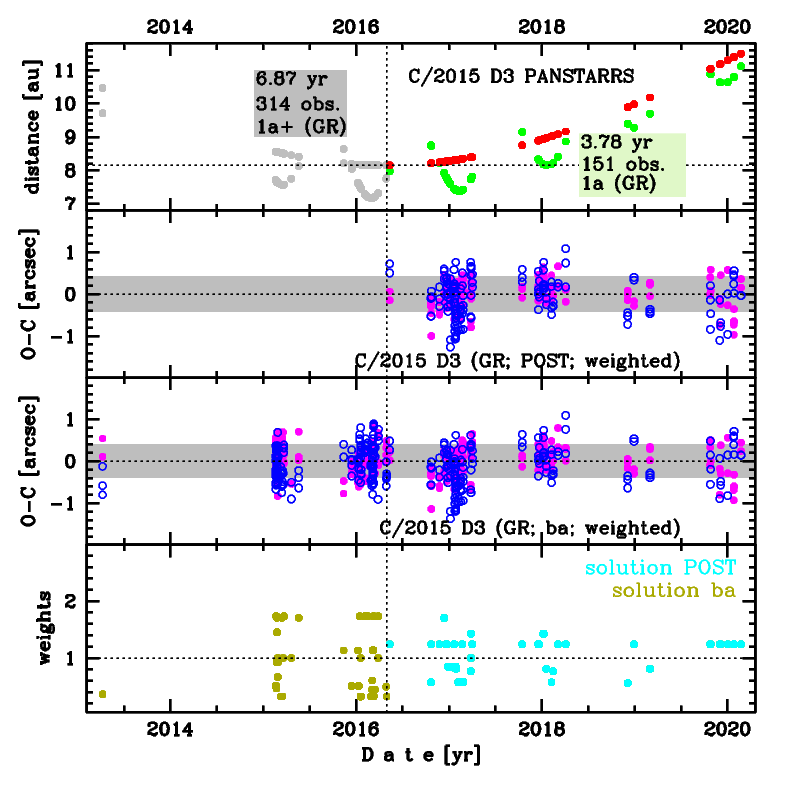
Upper panel: Time distribution of positional observations with corresponding heliocentric (red curve) and geocentric (green curve) distance at which they were taken. The horizontal dotted line shows the perihelion distance for a given comet whereas vertical dotted line — the moment of perihelion passage.
Middle panel(s): O-C diagram for a given solution (sometimes in comparison to another solution available in CODE), where residuals in right ascension are shown using magenta dots and in declination by blue open circles.
Lowest panel: Relative weights for a given data set(s).
Middle panel(s): O-C diagram for a given solution (sometimes in comparison to another solution available in CODE), where residuals in right ascension are shown using magenta dots and in declination by blue open circles.
Lowest panel: Relative weights for a given data set(s).
| next_g orbit statistics, here only the Galactic tide has been included | ||
|---|---|---|
| no. of returning VCs in the swarm | 0 | |
| no. of escaping VCs in the swarm | 5001 | |
| no. of hyperbolas among escaping VCs in the swarm | 5001 | * |
| next reciprocal semi-major axis [10-6 au-1] | -16.08 – -14.27 – -12.46 | |
| next perihelion distance [au] | 24.8 – 25.6 – 26.5 | |
| synchronous stop epoch [Myr] | 2.51 | S |
| percentage of VCs with qnext > 20 | 100 | |