C/2015 K7
more info
Comet C/2015 K7 was discovered on 17 May 2015 with the Subaru Telescope (Maunakea), that is more than two years after its perihelion passage. Fortunately, many pre-discoveries measurements were next found going back to 9 March 2013 (about two weeks after perihelion passage).
Thus, the GR solution given here is based on post-perihelion data span over 2.21 yr in a range of heliocentric distances from 9.94 au to 10.90 au.
Comet had its closest approach to the Earth on 30 May 2013 (8.94 au), about 3 months after its perihelion passage.
This Oort spike comet suffers tiny planetary perturbations during its passage through the planetary system that lead to a more tight future orbit (semimajor axis of about 6,700 au).
| solution description | ||
|---|---|---|
| number of observations | 59 | |
| data interval | 2013 03 09 – 2015 05 26 | |
| data type | observed only after perihelion (POST) | |
| data arc selection | entire data set (STD) | |
| range of heliocentric distances | 9.94 au – 10.9au | |
| detectability of NG effects in the comet's motion | NG effects not determinable | |
| type of model of motion | GR - gravitational orbit | |
| data weighting | YES | |
| number of residuals | 118 | |
| RMS [arcseconds] | 0.26 | |
| orbit quality class | 1a | |
| next orbit statistics, both Galactic and stellar perturbations were taken into account | ||
|---|---|---|
| no. of returning VCs in the swarm | 5001 | * |
| no. of escaping VCs in the swarm | 0 | |
| no. of hyperbolas among escaping VCs in the swarm | 0 | |
| next reciprocal semi-major axis [10-6 au-1] | 148.21 – 150.70 – 153.15 | |
| next perihelion distance [au] | 9.8673 – 9.8722 – 9.8767 | |
| next aphelion distance [103 au] | 13 – 13.3 – 13.5 | |
| time interval to next perihelion [Myr] | 0.527 – 0.54 – 0.554 | |
| percentage of VCs with qnext < 10 | 100 | |
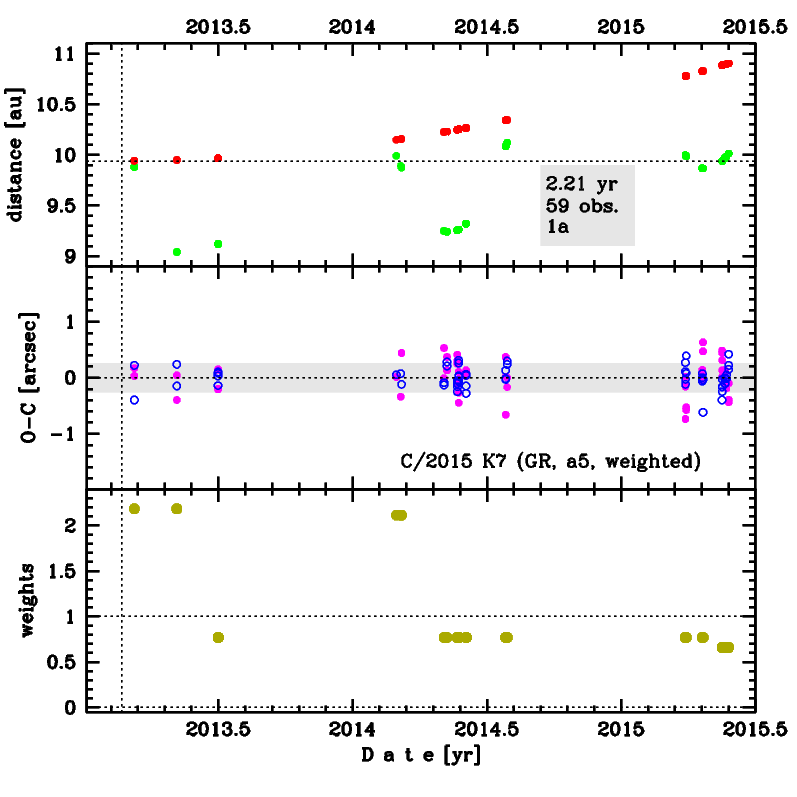
Time distribution of positional observations with corresponding heliocentric (red curve) and geocentric (green curve) distance at which they were taken. The horizontal dotted line shows the perihelion distance for a given comet whereas vertical dotted line — the moment of perihelion passage.
| next_g orbit statistics, here only the Galactic tide has been included | ||
|---|---|---|
| no. of returning VCs in the swarm | 5001 | * |
| no. of escaping VCs in the swarm | 0 | |
| no. of hyperbolas among escaping VCs in the swarm | 0 | |
| next reciprocal semi-major axis [10-6 au-1] | 148.18 – 150.67 – 153.12 | |
| next perihelion distance [au] | 9.867 – 9.8713 – 9.8753 | |
| next aphelion distance [103 au] | 13.1 – 13.3 – 13.5 | |
| time interval to next perihelion [Myr] | 0.527 – 0.54 – 0.554 | |
| percentage of VCs with qnext < 10 | 100 | |