C/2015 R3 PANSTARRS
more info
Comet C/2015 R3 was discovered on 12 September 2015 with Pan-STARRS 1 telescope (Haleakala), that is about 1.6 yr after its perihelion passage. After some time pre-discovery data were found going back to 5 March 2013. This comet was rarely observed until 28 September 2016.
Comet had its closest approach to the Earth on 8 May 2015 (4.939 au), a week after its perihelion passage.
We recommended GR solution spanning over 3.57 yr in a range of heliocentric distances from 5.57 au – 4.90 au (perihelion) – 8.54 au as the preferred orbit( solution 'b1'), because radial component of NG~acceleration is negative in solution 'bc'.
This Oort spike comet suffers small planetary perturbations during its passage through the planetary system that lead to a more tight future orbit with a semimajor axis larger than 10000 au (see future barycentric orbits).
| solution description | ||
|---|---|---|
| number of observations | 36 | |
| data interval | 2015 09 12 – 2016 09 28 | |
| data arc selection | data generally limited to post-perihelion (POS) | |
| range of heliocentric distances | 6.56 au – 8.54au | |
| detectability of NG effects in the comet's motion | comet with determinable NG~orbit | |
| type of model of motion | GR - gravitational orbit | |
| data weighting | YES | |
| number of residuals | 65 | |
| RMS [arcseconds] | 0.46 | |
| orbit quality class | 1b | |
| orbital elements (barycentric ecliptic J2000) | ||
|---|---|---|
| Epoch | 1708 01 08 | |
| perihelion date | 2014 02 11.05057441 | ± 0.01348511 |
| perihelion distance [au] | 4.90378128 | ± 0.00009831 |
| eccentricity | 0.99954882 | ± 0.00005572 |
| argument of perihelion [°] | 271.992673 | ± 0.001124 |
| ascending node [°] | 36.427445 | ± 0.000119 |
| inclination [°] | 83.532528 | ± 0.000278 |
| reciprocal semi-major axis [10-6 au-1] | 92.01 | ± 11.36 |
| file containing 5001 VCs swarm |
|---|
| 2015r3a1.bmi |
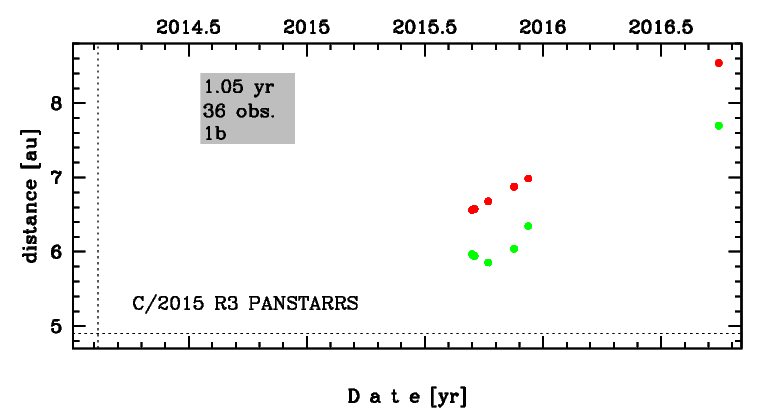
Time distribution of positional observations with corresponding heliocentric (red curve) and geocentric (green curve) distance at which they were taken. The horizontal dotted line shows the perihelion distance for a given comet whereas vertical dotted line — the moment of perihelion passage.
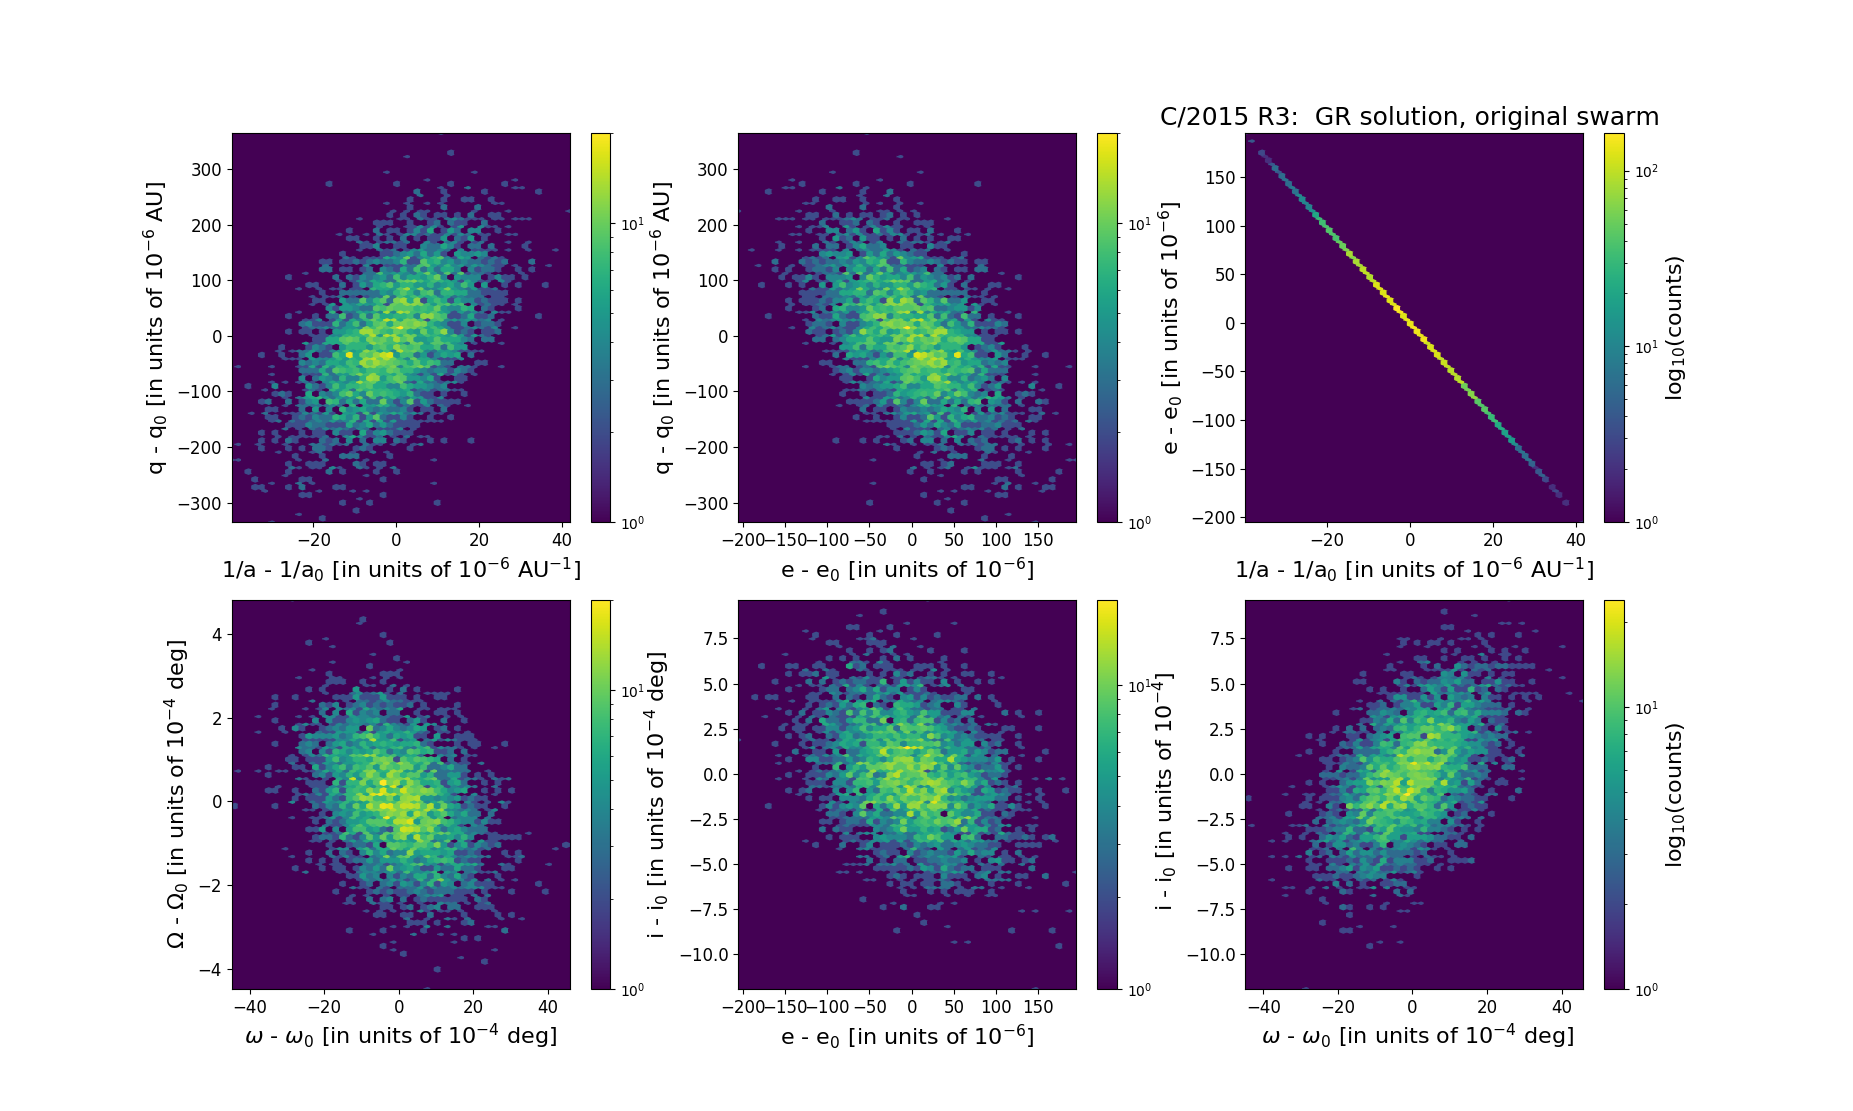
Six 2D-projections of the 6D space of original swarm including 5001 VCs. Each density map is given in logarithmic scale presented on the right in the individual panel.