C/2015 W1 Gibss
more info
Comet C/2015 W1 was discovered on 18 November 2015 by A.R. Gibbs (Catalina Sky Survey), that is half a year before its perihelion passage. Comet was followed until 3 July 2016. C/2015 V2 had closest approach to the Earth on 25 January 2016 (1.621 au, less than three months before the perihelion passage).
This is a comet with NG effects determinable using positional data fitting. Both solutions (GR and NG) are based on data spanning over 0.625 yr in a range of heliocentric distances: 3.01 au – 2.232 au (perihelion) – 2.30 au.
This Oort Cloud comet (GR orbit gives marginally Oort Cloud comet with original semimajor axis about 10,000 au whereas NG orbit – marginally hyperbolic) suffers moderate planetary perturbations during its passage through the planetary system; these perturbations lead to more tight future orbit, but predictions for GR and NG orbits are different (see future barycentric orbits).
| solution description | ||
|---|---|---|
| number of observations | 356 | |
| data interval | 2015 11 18 – 2016 07 03 | |
| data type | observed only after perihelion (POST) | |
| data arc selection | entire data set (STD) | |
| range of heliocentric distances | 3.01 au – 2.23 au (perihelion) – 2.3 au | |
| detectability of NG effects in the comet's motion | comet with determinable NG~orbit | |
| type of model of motion | GR - gravitational orbit | |
| data weighting | YES | |
| number of residuals | 700 | |
| RMS [arcseconds] | 0.48 | |
| orbit quality class | 1b | |
| next orbit statistics, both Galactic and stellar perturbations were taken into account | ||
|---|---|---|
| no. of returning VCs in the swarm | 5001 | * |
| no. of escaping VCs in the swarm | 0 | |
| no. of hyperbolas among escaping VCs in the swarm | 0 | |
| next reciprocal semi-major axis [10-6 au-1] | 552.19 – 556.90 – 561.53 | |
| next perihelion distance [au] | 2.23838 – 2.23839 – 2.23839 | |
| next aphelion distance [103 au] | 3.559 – 3.589 – 3.62 | |
| time interval to next perihelion [Myr] | 0.0748 – 0.0757 – 0.0767 | |
| percentage of VCs with qnext < 10 | 100 | |
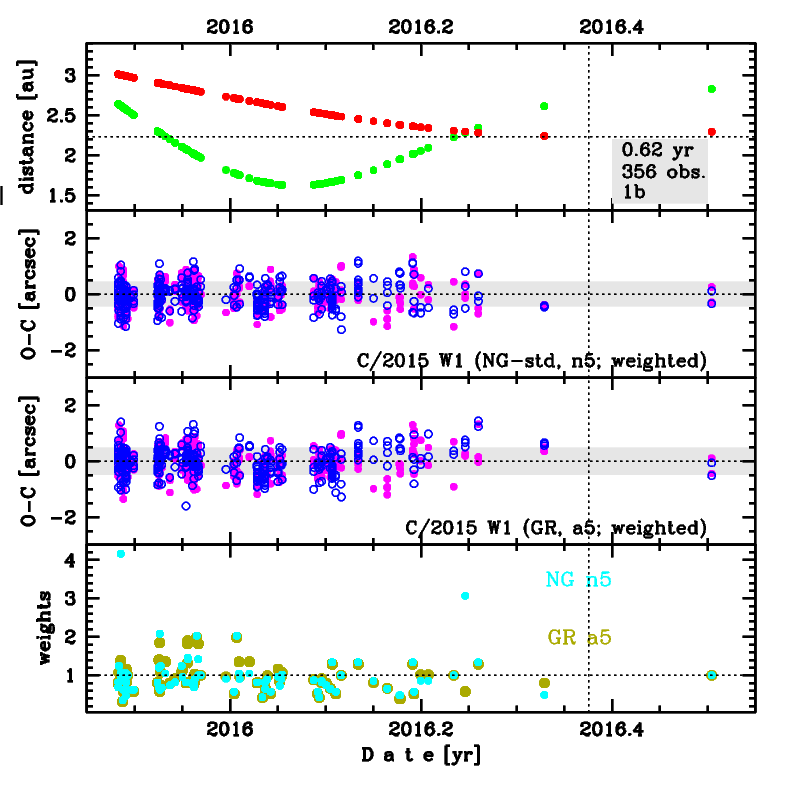
Upper panel: Time distribution of positional observations with corresponding heliocentric (red curve) and geocentric (green curve) distance at which they were taken. The horizontal dotted line shows the perihelion distance for a given comet whereas vertical dotted line — the moment of perihelion passage.
Middle panel(s): O-C diagram for a given solution (sometimes in comparison to another solution available in CODE), where residuals in right ascension are shown using magenta dots and in declination by blue open circles.
Lowest panel: Relative weights for a given data set(s).
Middle panel(s): O-C diagram for a given solution (sometimes in comparison to another solution available in CODE), where residuals in right ascension are shown using magenta dots and in declination by blue open circles.
Lowest panel: Relative weights for a given data set(s).
| next_g orbit statistics, here only the Galactic tide has been included | ||
|---|---|---|
| no. of returning VCs in the swarm | 5001 | * |
| no. of escaping VCs in the swarm | 0 | |
| no. of hyperbolas among escaping VCs in the swarm | 0 | |
| next reciprocal semi-major axis [10-6 au-1] | 552.19 – 556.90 – 561.53 | |
| next perihelion distance [au] | 2.23673 – 2.23673 – 2.23674 | |
| next aphelion distance [103 au] | 3.559 – 3.589 – 3.62 | |
| time interval to next perihelion [Myr] | 0.0748 – 0.0757 – 0.0767 | |
| percentage of VCs with qnext < 10 | 100 | |