C/2016 Q2 PANSTARRS
more info
Comet C/2016 Q2 was discovered on 26 August 2016 with the Pan-STARRS 1 telescope (Haleakala), that is more than 5 years before its perihelion passage. This comet was observed until the end of mid-2024 and is still observable.
Comet had its closest approach to the Earth on 24 May 2021 (6.805 au), about 2 weeks after its perihelion passage.
Preferred NG solution given here is based on data spanning over 7.63 yr in a range of heliocentric distances: 12.58 au – 7.08 au (perihelion) – 9.74 au.
This comet suffers tiny planetary perturbations during its passage through the planetary system; this is a long-period comet with original and future semimajor axes of about 7,500 au and 6,700 au, respectively.
#********************************** update of 'Oort spike' comets 2016 - 2020, comet no 2; long-period comet
| solution description | ||
|---|---|---|
| number of observations | 138 | |
| data interval | 2016 08 26 – 2019 10 29 | |
| data arc selection | data generally limited to pre-perihelion (PRE) | |
| range of heliocentric distances | 12.58 au – 7.94au | |
| detectability of NG effects in the comet's motion | comet with determinable NG~orbit | |
| type of model of motion | GR - gravitational orbit | |
| data weighting | YES | |
| number of residuals | 270 | |
| RMS [arcseconds] | 0.32 | |
| orbit quality class | 1a | |
| orbital elements (barycentric ecliptic J2000) | ||
|---|---|---|
| Epoch | 2331 12 28 | |
| perihelion date | 2021 05 09.82245760 | ± 0.00408922 |
| perihelion distance [au] | 7.08220965 | ± 0.00003091 |
| eccentricity | 0.99889111 | ± 0.00001034 |
| argument of perihelion [°] | 84.463864 | ± 0.000373 |
| ascending node [°] | 322.364999 | ± 0.000011 |
| inclination [°] | 109.384979 | ± 0.000029 |
| reciprocal semi-major axis [10-6 au-1] | 156.57 | ± 1.46 |
| file containing 5001 VCs swarm |
|---|
| 2016q2b5.bpl |
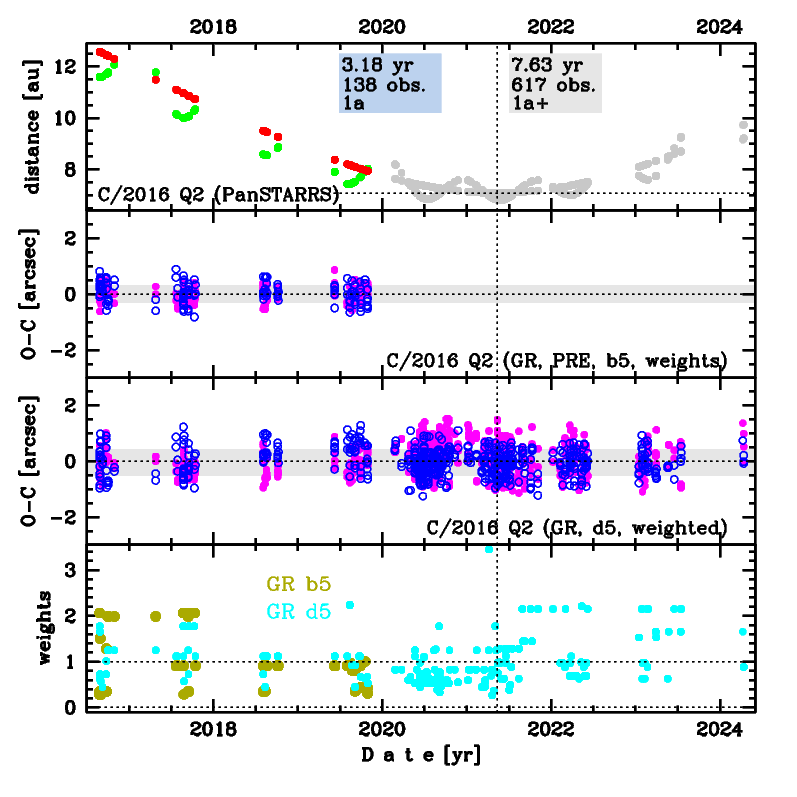
Upper panel: Time distribution of positional observations with corresponding heliocentric (red curve) and geocentric (green curve) distance at which they were taken. The horizontal dotted line shows the perihelion distance for a given comet whereas vertical dotted line — the moment of perihelion passage.
Middle panel(s): O-C diagram for a given solution (sometimes in comparison to another solution available in CODE), where residuals in right ascension are shown using magenta dots and in declination by blue open circles.
Lowest panel: Relative weights for a given data set(s).
Middle panel(s): O-C diagram for a given solution (sometimes in comparison to another solution available in CODE), where residuals in right ascension are shown using magenta dots and in declination by blue open circles.
Lowest panel: Relative weights for a given data set(s).
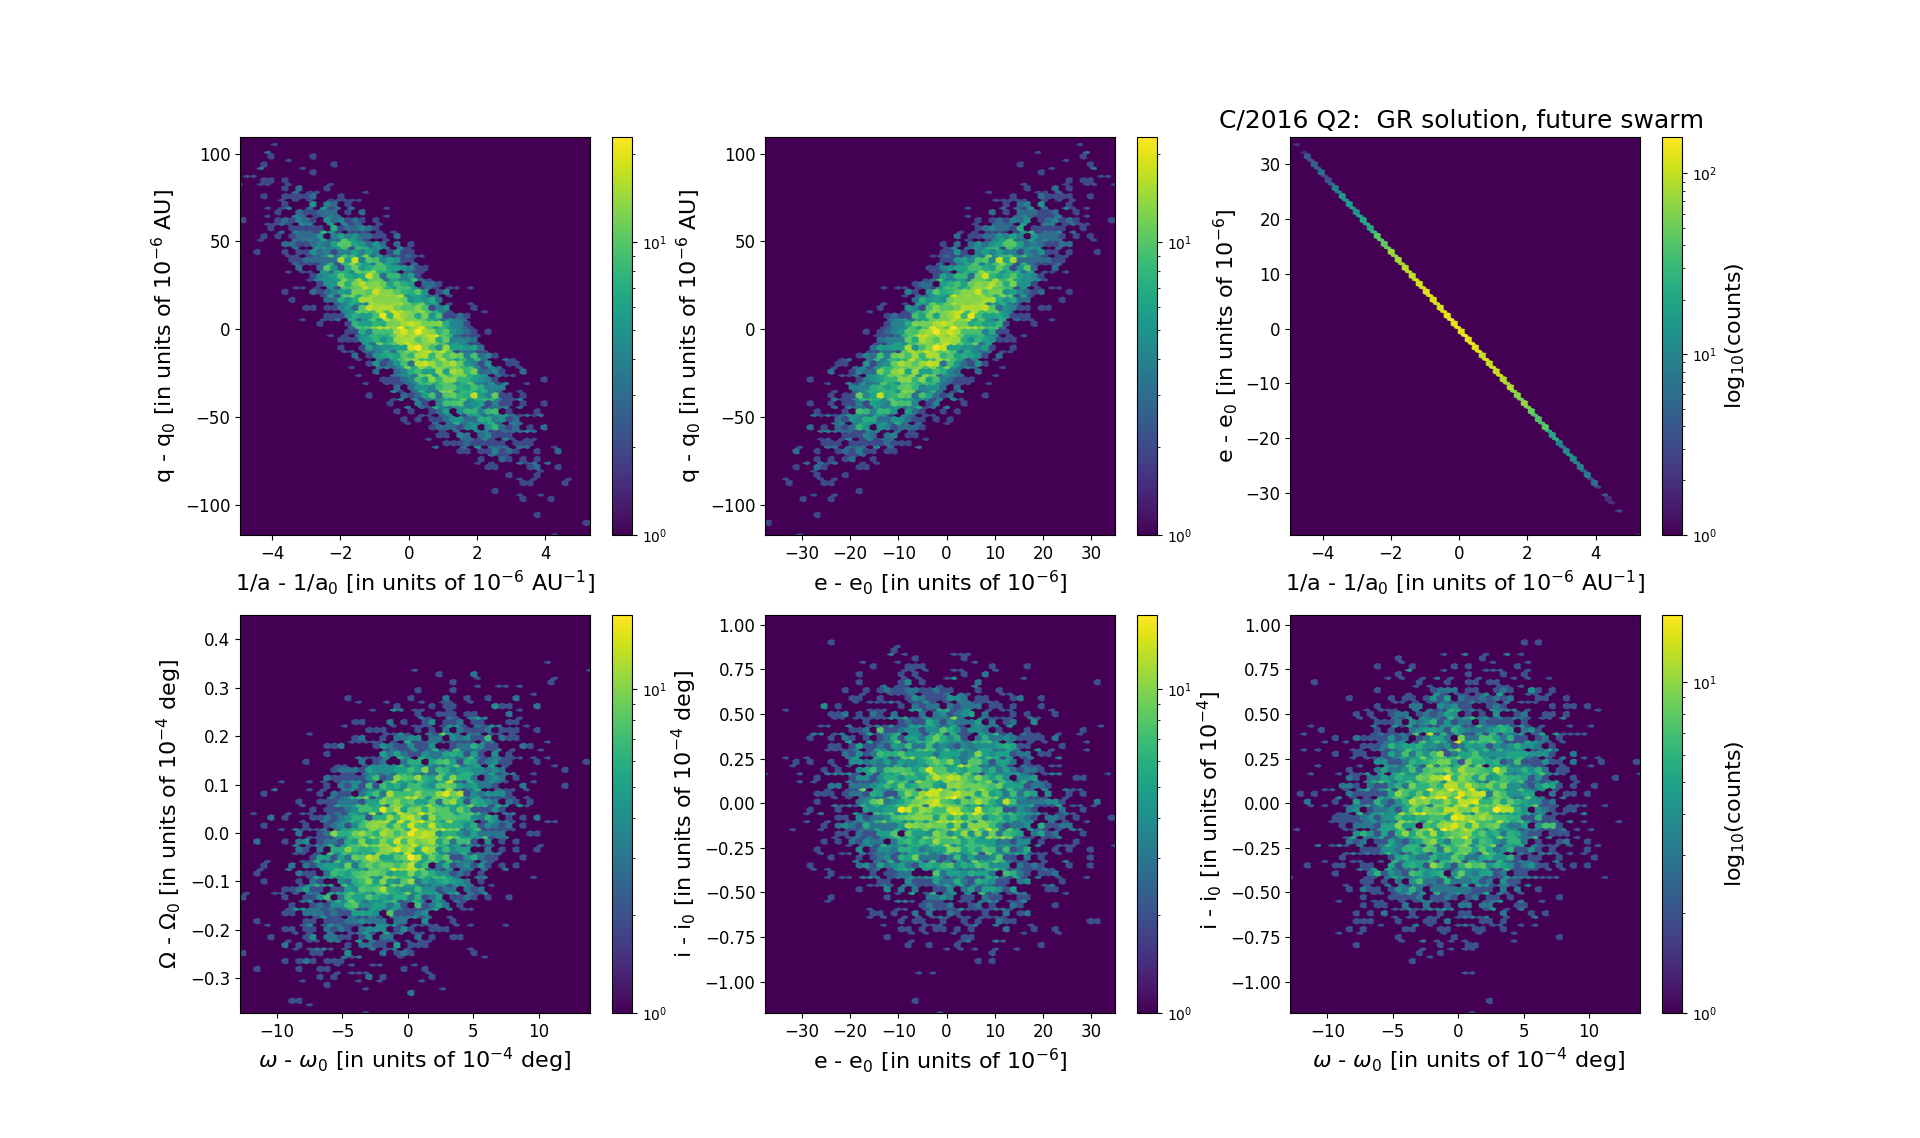
Six 2D-projections of the 6D space of future swarm including 5001 VCs. Each density map is given in logarithmic scale presented on the right in the individual panel.