C/2016 Q2 PANSTARRS
more info
Comet C/2016 Q2 was discovered on 26 August 2016 with the Pan-STARRS 1 telescope (Haleakala), that is more than 5 years before its perihelion passage. This comet was observed until the end of mid-2024 and is still observable.
Comet had its closest approach to the Earth on 24 May 2021 (6.805 au), about 2 weeks after its perihelion passage.
Preferred NG solution given here is based on data spanning over 7.63 yr in a range of heliocentric distances: 12.58 au – 7.08 au (perihelion) – 9.74 au.
This comet suffers tiny planetary perturbations during its passage through the planetary system; this is a long-period comet with original and future semimajor axes of about 7,500 au and 6,700 au, respectively.
#********************************** update of 'Oort spike' comets 2016 - 2020, comet no 2; long-period comet
| solution description | ||
|---|---|---|
| number of observations | 212 | |
| data interval | 2021 05 13 – 2024 04 12 | |
| data arc selection | data generally limited to post-perihelion (POS) | |
| range of heliocentric distances | 7.08 au – 9.74au | |
| detectability of NG effects in the comet's motion | comet with determinable NG~orbit | |
| type of model of motion | GR - gravitational orbit | |
| data weighting | YES | |
| number of residuals | 417 | |
| RMS [arcseconds] | 0.36 | |
| orbit quality class | 1a+ | |
| next orbit statistics, both Galactic and stellar perturbations were taken into account | ||
|---|---|---|
| no. of returning VCs in the swarm | 5001 | * |
| no. of escaping VCs in the swarm | 0 | |
| no. of hyperbolas among escaping VCs in the swarm | 0 | |
| next reciprocal semi-major axis [10-6 au-1] | 154.59 – 155.45 – 156.31 | |
| next perihelion distance [au] | 7.0067 – 7.0081 – 7.0094 | |
| next aphelion distance [103 au] | 12.79 – 12.86 – 12.93 | |
| time interval to next perihelion [Myr] | 0.511 – 0.5153 – 0.5196 | |
| percentage of VCs with qnext < 10 | 100 | |
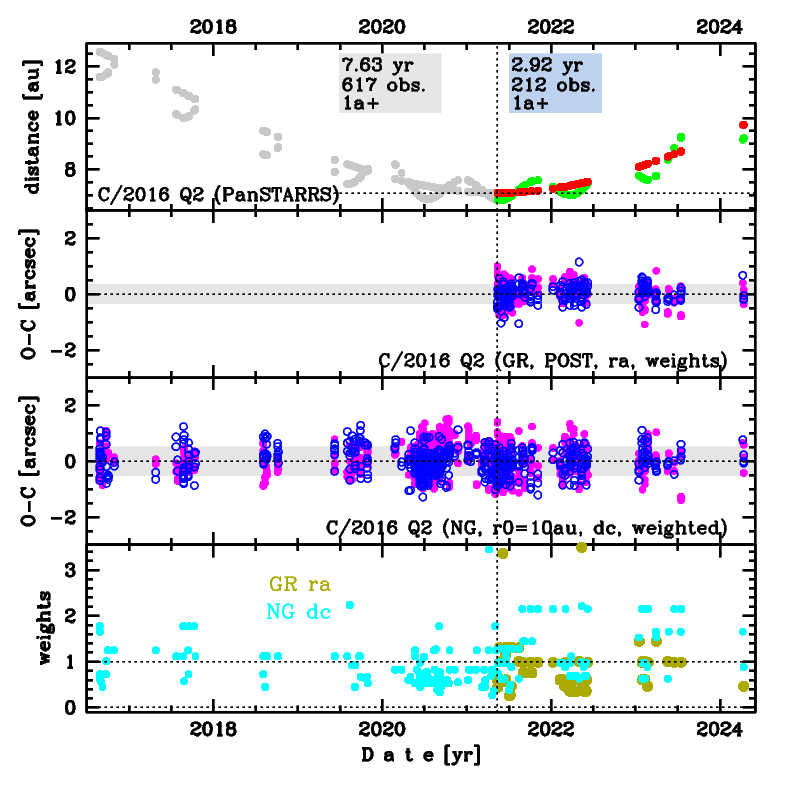
Upper panel: Time distribution of positional observations with corresponding heliocentric (red curve) and geocentric (green curve) distance at which they were taken. The horizontal dotted line shows the perihelion distance for a given comet whereas vertical dotted line — the moment of perihelion passage.
Middle panel(s): O-C diagram for a given solution (sometimes in comparison to another solution available in CODE), where residuals in right ascension are shown using magenta dots and in declination by blue open circles.
Lowest panel: Relative weights for a given data set(s).
Middle panel(s): O-C diagram for a given solution (sometimes in comparison to another solution available in CODE), where residuals in right ascension are shown using magenta dots and in declination by blue open circles.
Lowest panel: Relative weights for a given data set(s).
| next_g orbit statistics, here only the Galactic tide has been included | ||
|---|---|---|
| no. of returning VCs in the swarm | 5001 | * |
| no. of escaping VCs in the swarm | 0 | |
| no. of hyperbolas among escaping VCs in the swarm | 0 | |
| next reciprocal semi-major axis [10-6 au-1] | 154.59 – 155.46 – 156.31 | |
| next perihelion distance [au] | 7.0061 – 7.0076 – 7.009 | |
| next aphelion distance [103 au] | 12.79 – 12.86 – 12.93 | |
| time interval to next perihelion [Myr] | 0.511 – 0.5152 – 0.5195 | |
| percentage of VCs with qnext < 10 | 100 | |