C/2017 U4 PANSTARRS
more info
Comet C/2017 U4 was discovered on 27 October 2017 with Pan-STARRS 1 telescope (Haleakala), that is about 11 months before its perihelion passage. Few prediscovery images of this comet were found: taken by the same survey from 2 January 2017.This comet was observed until 26 February 2020.
Comet had its closest approach to the Earth on 11 December 2018 (6.761 au), about 2.5 months after its perihelion passage.
The preferred solution given here is based on data spanning over 3.15 yr in a range of heliocentric distances: 8.64 au – 7.72 au (perihelion) – 8.36 au.
This near-parabolic comet suffers tiny planetary perturbations during its passage through the planetary system (original and future semimajor axes around 9,000 au).
| solution description | ||
|---|---|---|
| number of observations | 69 | |
| data interval | 2017 01 02 – 2018 10 10 | |
| data arc selection | data generally limited to pre-perihelion (PRE) | |
| range of heliocentric distances | 8.64 au – 7.72 au (perihelion) – 7.72 au | |
| detectability of NG effects in the comet's motion | NG effects not determinable | |
| type of model of motion | GR - gravitational orbit | |
| data weighting | YES | |
| number of residuals | 128 | |
| RMS [arcseconds] | 0.34 | |
| orbit quality class | 1b | |
| next orbit statistics, both Galactic and stellar perturbations were taken into account | ||
|---|---|---|
| no. of returning VCs in the swarm | 5001 | * |
| no. of escaping VCs in the swarm | 0 | |
| no. of hyperbolas among escaping VCs in the swarm | 0 | |
| next reciprocal semi-major axis [10-6 au-1] | 102.51 – 108.24 – 114.09 | |
| next perihelion distance [au] | 7.7016 – 7.7052 – 7.7082 | |
| next aphelion distance [103 au] | 17.5 – 18.5 – 19.5 | |
| time interval to next perihelion [Myr] | 0.82 – 0.887 – 0.963 | |
| percentage of VCs with qnext < 10 | 100 | |
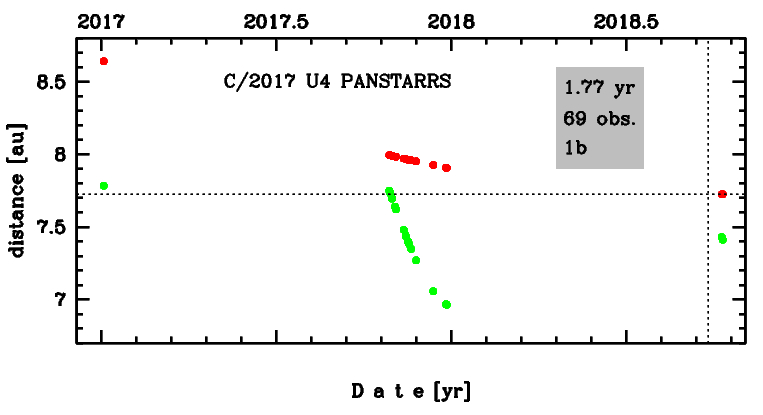
Time distribution of positional observations with corresponding heliocentric (red curve) and geocentric (green curve) distance at which they were taken. The horizontal dotted line shows the perihelion distance for a given comet whereas vertical dotted line — the moment of perihelion passage.
| next_g orbit statistics, here only the Galactic tide has been included | ||
|---|---|---|
| no. of returning VCs in the swarm | 5001 | * |
| no. of escaping VCs in the swarm | 0 | |
| no. of hyperbolas among escaping VCs in the swarm | 0 | |
| next reciprocal semi-major axis [10-6 au-1] | 102.48 – 108.21 – 114.06 | |
| next perihelion distance [au] | 7.7213 – 7.7227 – 7.7238 | |
| next aphelion distance [103 au] | 17.5 – 18.5 – 19.5 | |
| time interval to next perihelion [Myr] | 0.82 – 0.888 – 0.963 | |
| percentage of VCs with qnext < 10 | 100 | |