C/2019 Q1 Lemmon
more info
Comet C/2019 Q1 was discovered on 28 August 2019, almost one year before its perihelion passage. Later two series of pre-discovery observations were found from 2 January 2019 and 10 November 2018. This comet was observed until 4 June 2021.
Comet had its closest approach to the Earth on 3 September 2020 (4.09 au); 1.5 month after its perihelion passage.
Solutions (GR and NG) given here are based on data span over 2.56 yr in a range of heliocentric distances: 6.80 au – 5.00 au (perihelion) – 5.56 au. Orbits based on pre-perihelion and post-perihelion data independently were also obtained.
This Oort spike comet suffers small planetary perturbations during its passage through the planetary system; however, they lead to escape this comet from the solar system on hyperbolic orbit (see future barycentric orbits).
| solution description | ||
|---|---|---|
| number of observations | 160 | |
| data interval | 2018 11 10 – 2020 07 16 | |
| data arc selection | data generally limited to pre-perihelion (PRE) | |
| range of heliocentric distances | 6.8 au – 5au | |
| type of model of motion | NC - non-gravitational orbits for symmetric CO-g(r)-like function | |
| data weighting | YES | |
| number of residuals | 314 | |
| RMS [arcseconds] | 0.34 | |
| orbit quality class | 1b | |
| previous orbit statistics, both Galactic and stellar perturbations were taken into account | ||
|---|---|---|
| no. of returning VCs in the swarm | 4358 | * |
| no. of escaping VCs in the swarm | 643 | |
| no. of hyperbolas among escaping VCs in the swarm | 6 | |
| previous reciprocal semi-major axis [10-6 au-1] | 18.63 – 27.21 – 38.83 | R |
| previous perihelion distance [au] | 340 – 770 – 880 | R |
| previous aphelion distance [103 au] | 51 – 73 – 110 | R |
| time interval to previous perihelion [Myr] | 4.2 – 6.9 – 11 | R |
| percentage of VCs with qprev > 20 | 100 | |
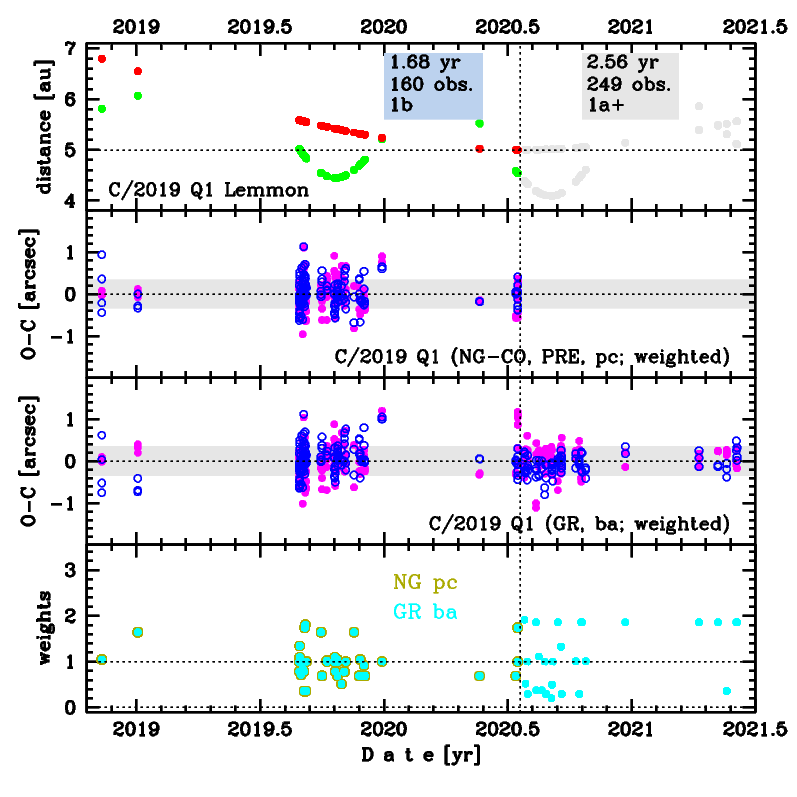
Upper panel: Time distribution of positional observations with corresponding heliocentric (red curve) and geocentric (green curve) distance at which they were taken. The horizontal dotted line shows the perihelion distance for a given comet whereas vertical dotted line — the moment of perihelion passage.
Middle panel(s): O-C diagram for a given solution (sometimes in comparison to another solution available in CODE), where residuals in right ascension are shown using magenta dots and in declination by blue open circles.
Lowest panel: Relative weights for a given data set(s).
Middle panel(s): O-C diagram for a given solution (sometimes in comparison to another solution available in CODE), where residuals in right ascension are shown using magenta dots and in declination by blue open circles.
Lowest panel: Relative weights for a given data set(s).
| previous_g orbit statistics, here only the Galactic tide has been included | ||
|---|---|---|
| no. of returning VCs in the swarm | 4580 | * |
| no. of escaping VCs in the swarm | 421 | |
| no. of hyperbolas among escaping VCs in the swarm | 2 | |
| previous reciprocal semi-major axis [10-6 au-1] | 19.56 – 28.14 – 38.47 | R |
| previous perihelion distance [au] | 4 – 22 – 280 | R |
| previous aphelion distance [103 au] | 52 – 71 – 100 | R |
| time interval to previous perihelion [Myr] | 4.1 – 6.5 – 11 | R |
| percentage of VCs with qprev < 10 | 33 | |
| percentage of VCs with 10 < qprev < 20 | 15 | |
| percentage of VCs with qprev > 20 | 52 | |