C/2020 F2 ATLAS
more info
Comet C/2020 F2 was discovered on 21 March 2020, more than three years before its perihelion passage. Later a series of pre-discovery observations were found going back to 27 May 2019 (heliocentric disctance: 10.96 au). This comet was observed until 30 May 2024 (as in February 2025).
Comet had its closest approach to the Earth on 19 April 2022 (7.85 au); about three months before its perihelion passage.
The preferred GR solution given here is based on data span over 5.01 yr in a range of heliocentric distances: 10.96 au – 8.82 au (perihelion) – 9.66 au.
This Oort spike comet suffers tiny planetary perturbations during its passage through the planetary system that lead to a bit less tight future orbit inside the Oort spike zone (see future barycentric orbits).
| solution description | ||
|---|---|---|
| number of observations | 1247 | |
| data interval | 2019 05 27 – 2022 07 14 | |
| data arc selection | data generally limited to pre-perihelion (PRE) | |
| range of heliocentric distances | 10.96 au – 8.82au | |
| detectability of NG effects in the comet's motion | NG effects not determinable | |
| type of model of motion | GR - gravitational orbit | |
| data weighting | YES | |
| number of residuals | 2468 | |
| RMS [arcseconds] | 0.31 | |
| orbit quality class | 1a+ | |
| orbital elements (barycentric ecliptic J2000) | ||
|---|---|---|
| Epoch | 1710 02 26 | |
| perihelion date | 2022 07 13.33672262 | ± 0.00132004 |
| perihelion distance [au] | 8.82670971 | ± 0.00000537 |
| eccentricity | 0.99944961 | ± 0.00000335 |
| argument of perihelion [°] | 48.119694 | ± 0.000074 |
| ascending node [°] | 250.151708 | ± 0.000016 |
| inclination [°] | 163.615618 | ± 0.000008 |
| reciprocal semi-major axis [10-6 au-1] | 62.35 | ± 0.38 |
| file containing 5001 VCs swarm |
|---|
| 2020f2pb.bmi |
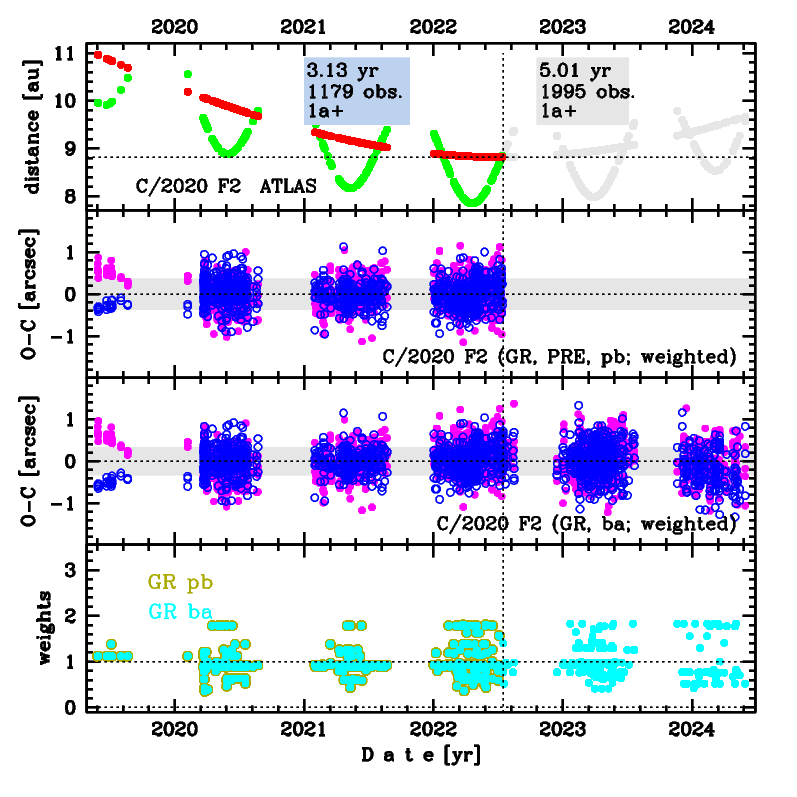
Upper panel: Time distribution of positional observations with corresponding heliocentric (red curve) and geocentric (green curve) distance at which they were taken. The horizontal dotted line shows the perihelion distance for a given comet whereas vertical dotted line — the moment of perihelion passage.
Middle panel(s): O-C diagram for a given solution (sometimes in comparison to another solution available in CODE), where residuals in right ascension are shown using magenta dots and in declination by blue open circles.
Lowest panel: Relative weights for a given data set(s).
Middle panel(s): O-C diagram for a given solution (sometimes in comparison to another solution available in CODE), where residuals in right ascension are shown using magenta dots and in declination by blue open circles.
Lowest panel: Relative weights for a given data set(s).
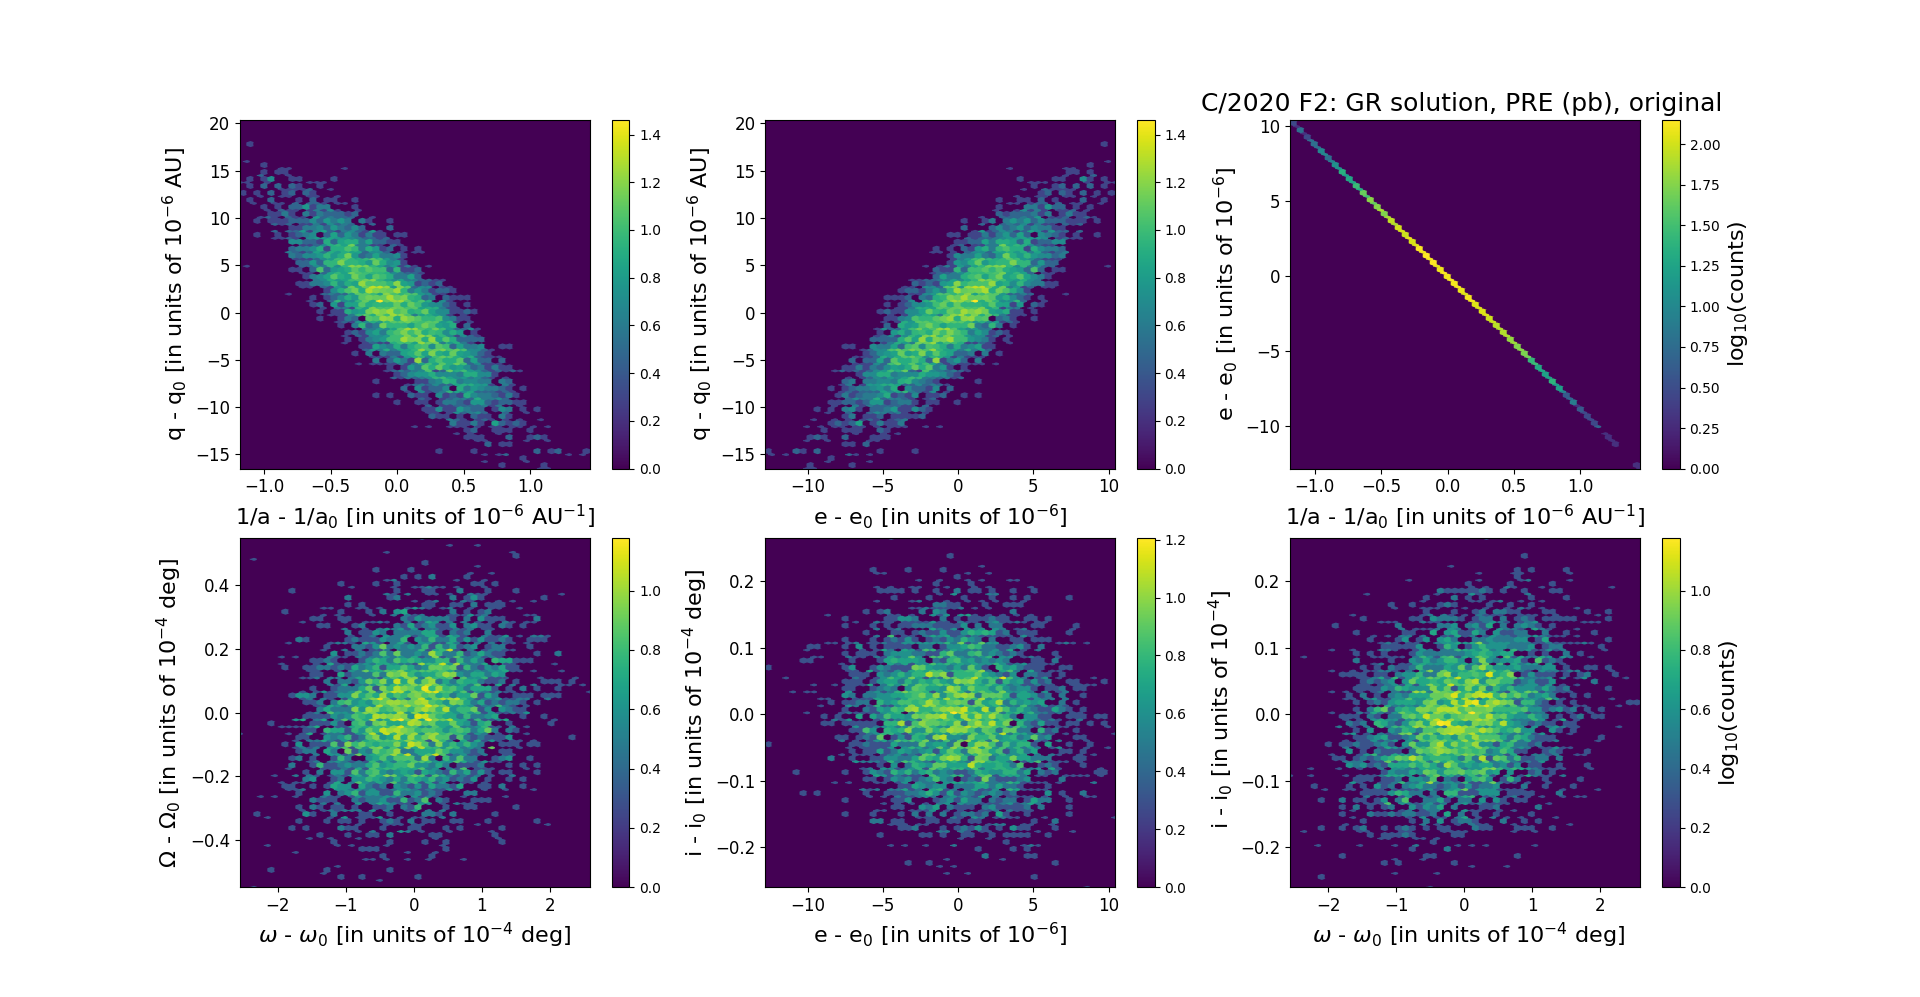
Six 2D-projections of the 6D space of original swarm including 5001 VCs. Each density map is given in logarithmic scale presented on the right in the individual panel.