C/2020 R7 ATLAS
more info
Comet C/2020 R7 was discovered on 15 September 2020, two years before its perihelion passage. Later a series of observations were found from 3 December 2019. This comet was observed until 31 July 2024 (as in February 2025).
Comet had its closest approach to the Earth on 15 Julyl 2022 (2.18 au); about 2 months before its perihelion passage.
Currently, the preferred NG solution given here is based on data span over 4.66 yr in a range of heliocentric distances: 9.08 au – 2.96 au (perihelion) – 6.81 au. This comet shows large trends in the O-C distribution for a purely gravitational orbit. However, still some trends in [O-C] are visible for NG solutions based on full data arc (see solution 'c5' or 'n5'), trends substantially decrease for NG orbit based on pre-perihelion data atc (solution 'pc').
This Oort spike comet suffers moderate planetary perturbations during its passage through the planetary system that lead to a more tight future orbit (semimajor axis of about 1,800 au).
| solution description | ||
|---|---|---|
| number of observations | 1836 | |
| data interval | 2019 12 03 – 2024 07 31 | |
| data type | perihelion within the observation arc (FULL) | |
| data arc selection | entire data set (STD) | |
| range of heliocentric distances | 9.08 au – 2.96 au (perihelion) – 6.81 au | |
| detectability of NG effects in the comet's motion | comet with NG effects strongly manifested in positional data fitting | |
| type of model of motion | GR - gravitational orbit | |
| data weighting | YES | |
| number of residuals | 3617 | |
| RMS [arcseconds] | 0.52 | |
| orbit quality class | 1a+ | |
| previous orbit statistics, both Galactic and stellar perturbations were taken into account | ||
|---|---|---|
| no. of returning VCs in the swarm | 5001 | * |
| no. of escaping VCs in the swarm | 0 | |
| no. of hyperbolas among escaping VCs in the swarm | 0 | |
| previous reciprocal semi-major axis [10-6 au-1] | 22.01 – 22.39 – 22.76 | |
| previous perihelion distance [au] | 929 – 951 – 971 | |
| previous aphelion distance [103 au] | 86.9 – 88.4 – 89.9 | |
| time interval to previous perihelion [Myr] | 9.07 – 9.31 – 9.55 | |
| percentage of VCs with qprev > 20 | 100 | |
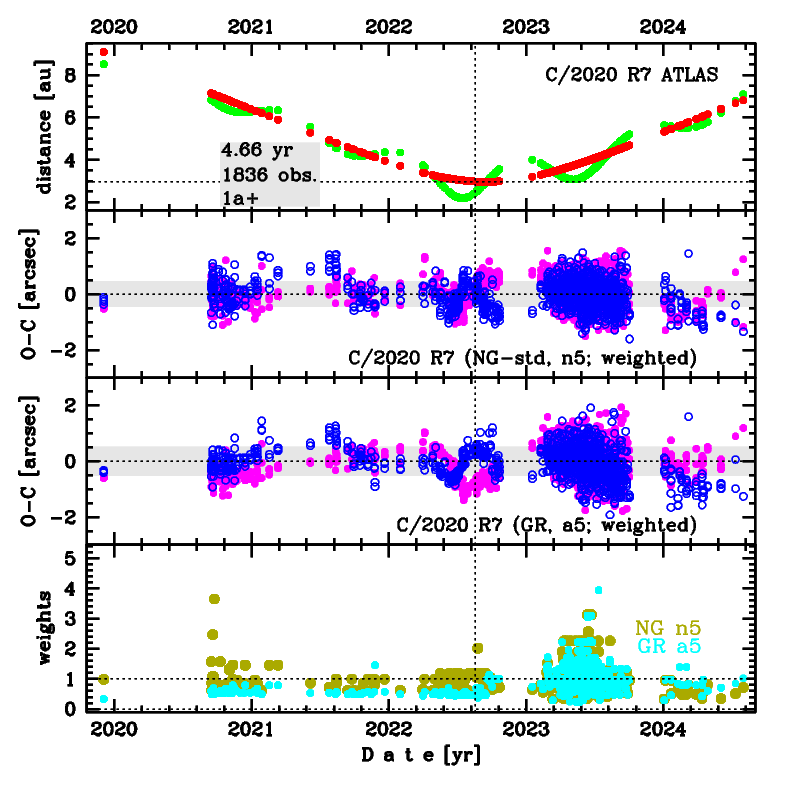
Upper panel: Time distribution of positional observations with corresponding heliocentric (red curve) and geocentric (green curve) distance at which they were taken. The horizontal dotted line shows the perihelion distance for a given comet whereas vertical dotted line — the moment of perihelion passage.
Middle panel(s): O-C diagram for a given solution (sometimes in comparison to another solution available in CODE), where residuals in right ascension are shown using magenta dots and in declination by blue open circles.
Lowest panel: Relative weights for a given data set(s).
Middle panel(s): O-C diagram for a given solution (sometimes in comparison to another solution available in CODE), where residuals in right ascension are shown using magenta dots and in declination by blue open circles.
Lowest panel: Relative weights for a given data set(s).
| previous_g orbit statistics, here only the Galactic tide has been included | ||
|---|---|---|
| no. of returning VCs in the swarm | 5001 | * |
| no. of escaping VCs in the swarm | 0 | |
| no. of hyperbolas among escaping VCs in the swarm | 0 | |
| previous reciprocal semi-major axis [10-6 au-1] | 21.94 – 22.36 – 22.77 | |
| previous perihelion distance [au] | 11 – 14 – 16 | |
| previous aphelion distance [103 au] | 87.8 – 89.4 – 91.1 | |
| time interval to previous perihelion [Myr] | 9.32 – 9.58 – 9.86 | |
| percentage of VCs with qprev < 10 | 2 | |
| percentage of VCs with 10 < qprev < 20 | 98 | |