C/2014 UN271 Bernardinelli-Bernstein
more info
The discovery of C/2014 UN271 was announced in June 2021 by Bernardinelli & Bernstein (2021) on the basis of astrometric observations spanning 20 nights from 20 October 2014 to 8 November 2018 (29.0 au – 23.7 au from the Sun). A little later, at a heliocentric distance of over 20 au, observers reported the cometary activity of C/2014 UN271.
The comet will pass through perihelion (10.95 au from the Sun) on 22 January 2031; thus solutions given here are currently based on pre-perihelion data taken at large heliocentric distances.
Most probably, this Oort spike comet suffers small planetary perturbations during its passage through the planetary system.
More details in Dybczyński and Królikowska 2022 (or Dybczyński and Królikowska 2022).
| solution description | ||
|---|---|---|
| number of observations | 114 | |
| data interval | 2010 11 15 – 2021 09 19 | |
| data arc selection | data generally limited to pre-perihelion (PRE) | |
| range of heliocentric distances | 34.07 au – 19.85au | |
| detectability of NG effects in the comet's motion | NG effects not determinable | |
| type of model of motion | GR - gravitational orbit | |
| data weighting | YES | |
| number of residuals | 210 | |
| RMS [arcseconds] | 0.13 | |
| orbit quality class | 1a+ | |
| orbital elements (heliocentric ecliptic J2000) | ||
|---|---|---|
| Epoch | 2031 01 14 | |
| perihelion date | 2031 01 22.91814766 | ± 0.01228715 |
| perihelion distance [au] | 10.95006778 | ± 0.00007320 |
| eccentricity | 1.00070870 | ± 0.00000622 |
| argument of perihelion [°] | 326.321635 | ± 0.000367 |
| ascending node [°] | 190.023619 | ± 0.000025 |
| inclination [°] | 95.454594 | ± 0.000023 |
| reciprocal semi-major axis [10-6 au-1] | -64.72 | ± 0.57 |
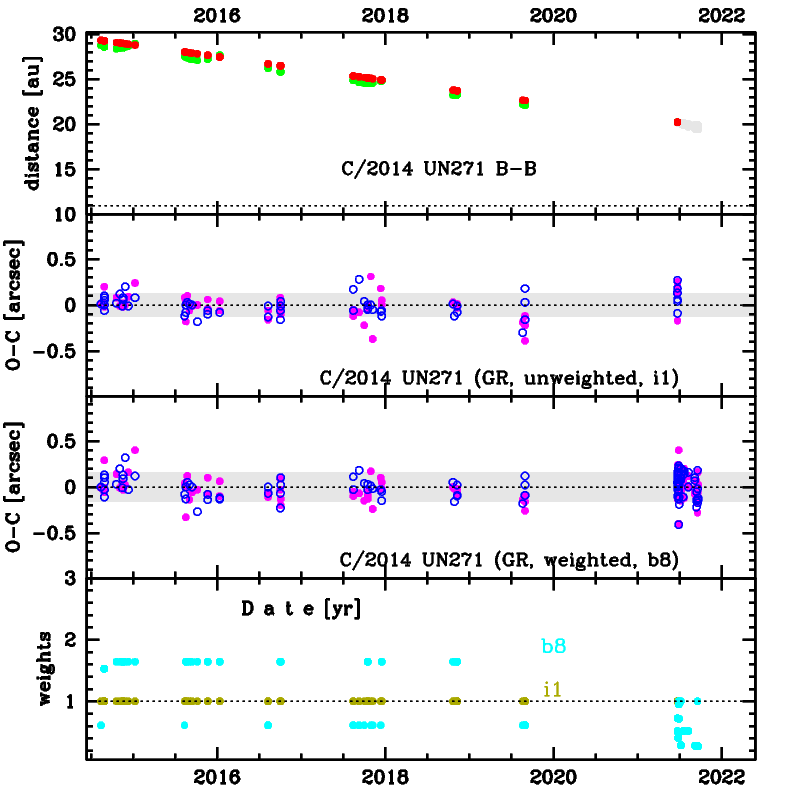
Upper panel: Time distribution of positional observations with corresponding heliocentric (red curve) and geocentric (green curve) distance at which they were taken. The horizontal dotted line shows the perihelion distance for a given comet whereas vertical dotted line — the moment of perihelion passage.
Middle panel(s): O-C diagram for a given solution (sometimes in comparison to another solution available in CODE), where residuals in right ascension are shown using magenta dots and in declination by blue open circles.
Lowest panel: Relative weights for a given data set(s).
Middle panel(s): O-C diagram for a given solution (sometimes in comparison to another solution available in CODE), where residuals in right ascension are shown using magenta dots and in declination by blue open circles.
Lowest panel: Relative weights for a given data set(s).