C/2011 U3 McNaught
more info
Comet C/2011 U3 was discovered on 24 October 2011 with Pan-STARRS 1 telescope (Haleakala), that is 7.5 months before its perihelion passage. It was observed until 26 January 2012.
Comet had its closest observed approach to the Earth on 3 December 2011 (2.002 au), more than a month after its discovery. If C/2011 U3 survived its perihelion passage it passed 0.814 au from the Earth on 24 June 2012.
Solution given here is based on pre-perihelion data spanning over 0.257 yr in a range of heliocentric distances from 3.31 au to 2.24 au.
This Oort spike comet suffered moderate planetary perturbations during its passage through the inner part of our planetary system.
C/2011 U3 was observed only before peryhelion; however, the future orbit is given here.
See also Królikowska 2020.
| solution description | ||
|---|---|---|
| number of observations | 57 | |
| data interval | 2011 10 24 – 2012 01 26 | |
| data type | observed only before perihelion (PRE) | |
| data arc selection | entire data set (STD) | |
| range of heliocentric distances | 3.31 au – 2.24au | |
| detectability of NG effects in the comet's motion | NG effects not determinable | |
| type of model of motion | GR - gravitational orbit | |
| data weighting | NO | |
| number of residuals | 114 | |
| RMS [arcseconds] | 0.40 | |
| orbit quality class | 2a | |
| orbital elements (barycentric ecliptic J2000) | ||
|---|---|---|
| Epoch | 1713 06 10 | |
| perihelion date | 2012 06 03.03545691 | ± 0.00374010 |
| perihelion distance [au] | 1.06559597 | ± 0.00012294 |
| eccentricity | 0.99993376 | ± 0.00003386 |
| argument of perihelion [°] | 287.986247 | ± 0.005385 |
| ascending node [°] | 228.397820 | ± 0.000020 |
| inclination [°] | 116.752348 | ± 0.002566 |
| reciprocal semi-major axis [10-6 au-1] | 62.16 | ± 31.78 |
| file containing 5001 VCs swarm |
|---|
| 2011u3a5.bmi |
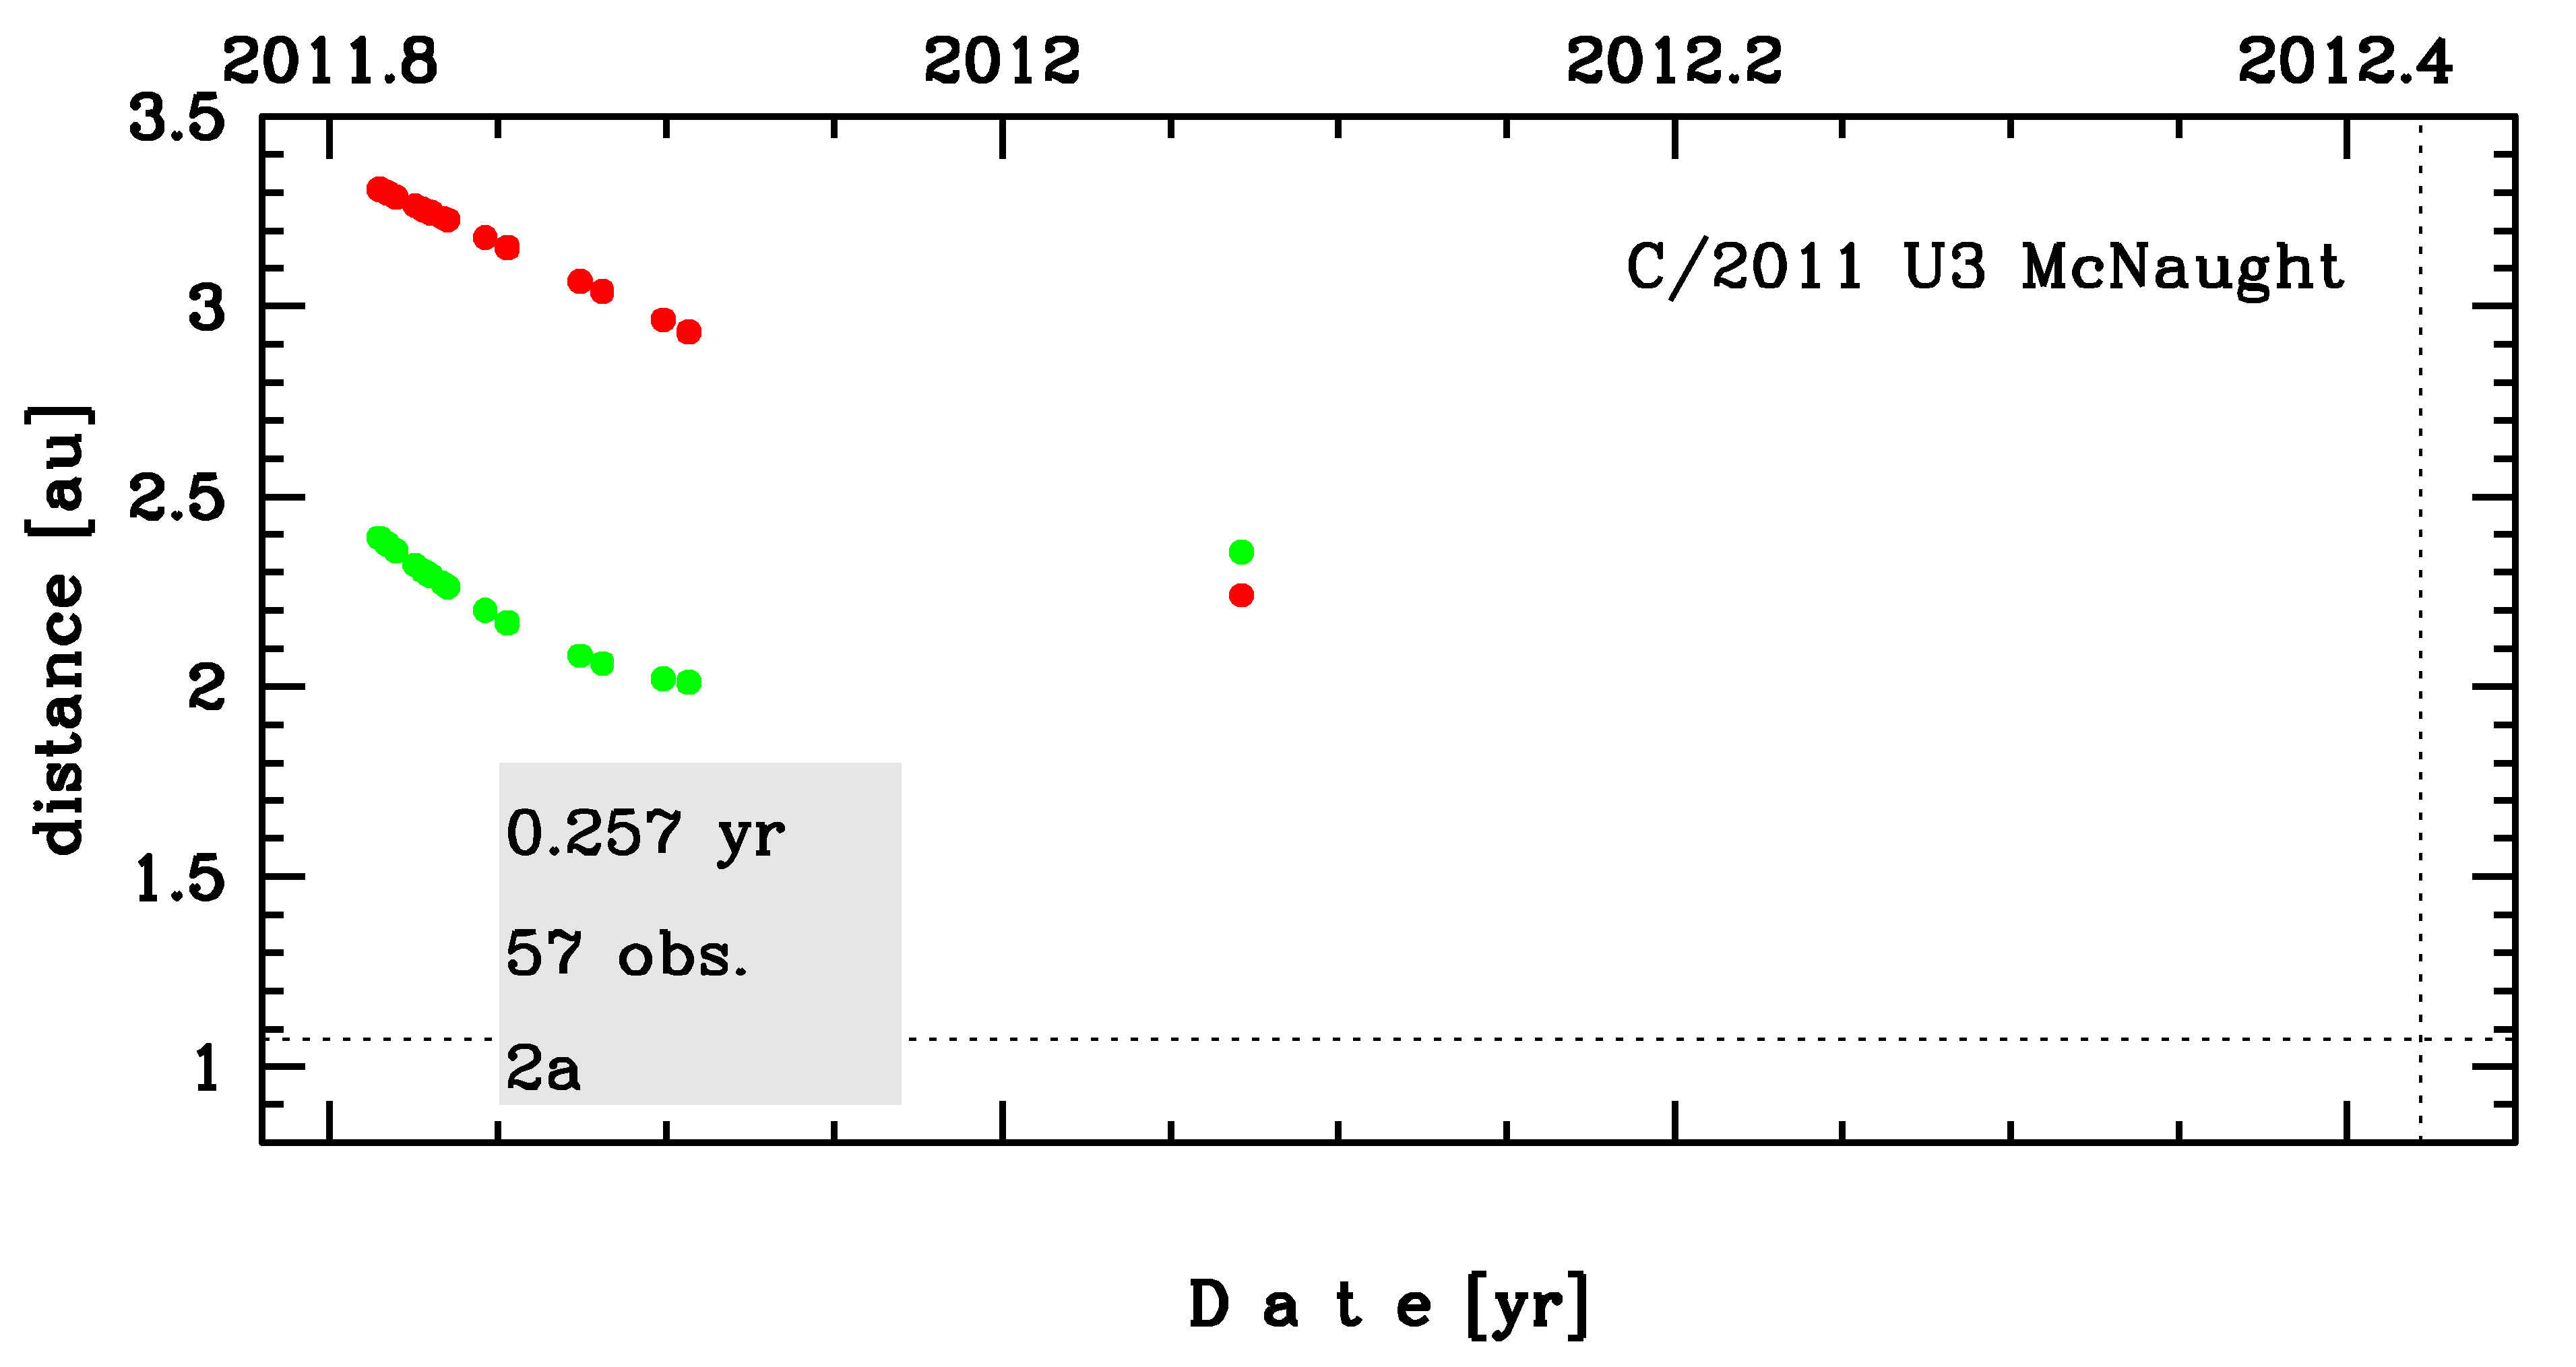
Time distribution of positional observations with corresponding heliocentric (red curve) and geocentric (green curve) distance at which they were taken. The horizontal dotted line shows the perihelion distance for a given comet whereas vertical dotted line — the moment of perihelion passage.
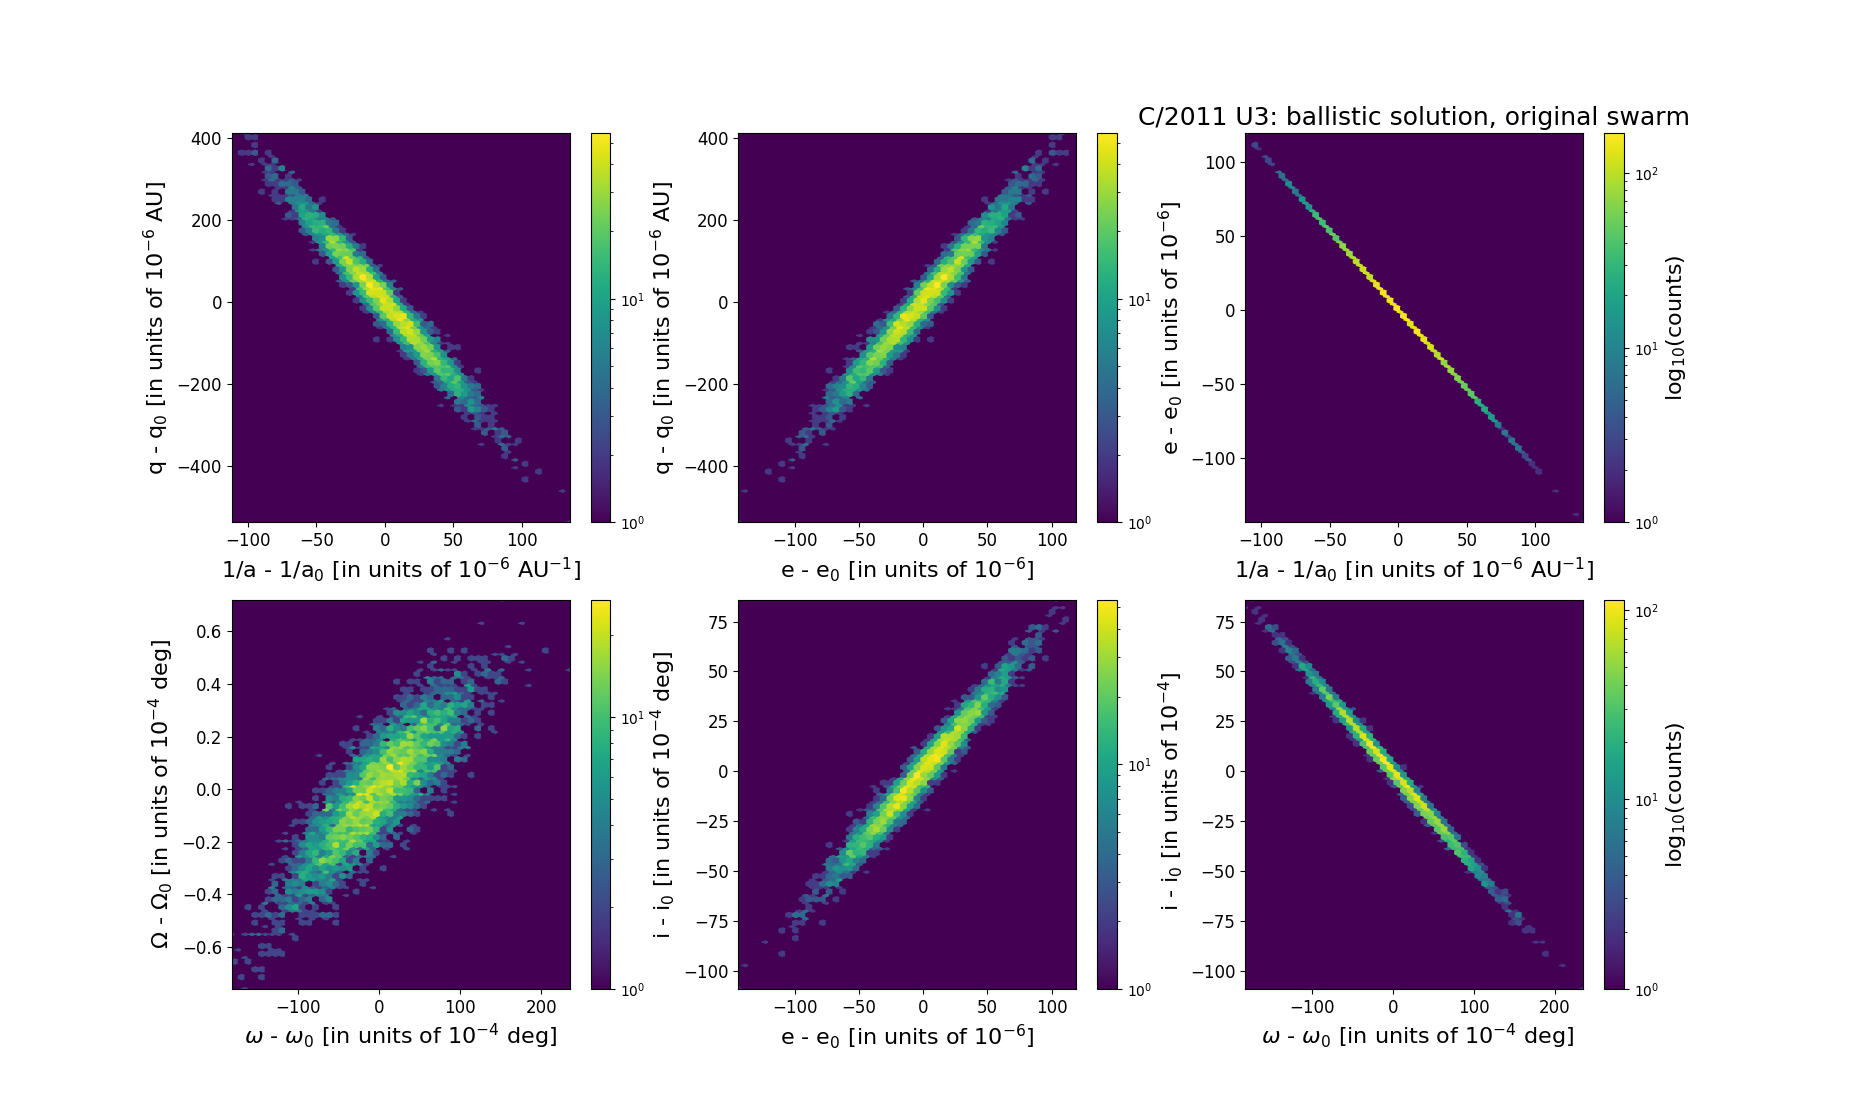
Six 2D-projections of the 6D space of original swarm including 5001 VCs. Each density map is given in logarithmic scale presented on the right in the individual panel.