C/2011 U3 McNaught
more info
Comet C/2011 U3 was discovered on 24 October 2011 with Pan-STARRS 1 telescope (Haleakala), that is 7.5 months before its perihelion passage. It was observed until 26 January 2012.
Comet had its closest observed approach to the Earth on 3 December 2011 (2.002 au), more than a month after its discovery. If C/2011 U3 survived its perihelion passage it passed 0.814 au from the Earth on 24 June 2012.
Solution given here is based on pre-perihelion data spanning over 0.257 yr in a range of heliocentric distances from 3.31 au to 2.24 au.
This Oort spike comet suffered moderate planetary perturbations during its passage through the inner part of our planetary system.
C/2011 U3 was observed only before peryhelion; however, the future orbit is given here.
See also Królikowska 2020.
| solution description | ||
|---|---|---|
| number of observations | 57 | |
| data interval | 2011 10 24 – 2012 01 26 | |
| data type | observed only before perihelion (PRE) | |
| data arc selection | entire data set (STD) | |
| range of heliocentric distances | 3.31 au – 2.24au | |
| detectability of NG effects in the comet's motion | NG effects not determinable | |
| type of model of motion | GR - gravitational orbit | |
| data weighting | NO | |
| number of residuals | 114 | |
| RMS [arcseconds] | 0.40 | |
| orbit quality class | 2a | |
| previous orbit statistics, both Galactic and stellar perturbations were taken into account | ||
|---|---|---|
| no. of returning VCs in the swarm | 4597 | * |
| no. of escaping VCs in the swarm | 404 | |
| no. of hyperbolas among escaping VCs in the swarm | 116 | |
| previous reciprocal semi-major axis [10-6 au-1] | 31.28 – 65.71 – 104.82 | R |
| previous perihelion distance [au] | 0.29 – 0.9 – 620 | R |
| previous aphelion distance [103 au] | 19 – 30 – 63 | R |
| time interval to previous perihelion [Myr] | 0.93 – 1.9 – 5.7 | R |
| percentage of VCs with qprev < 10 | 66 | |
| percentage of VCs with 10 < qprev < 20 | 1 | |
| percentage of VCs with qprev > 20 | 33 | |
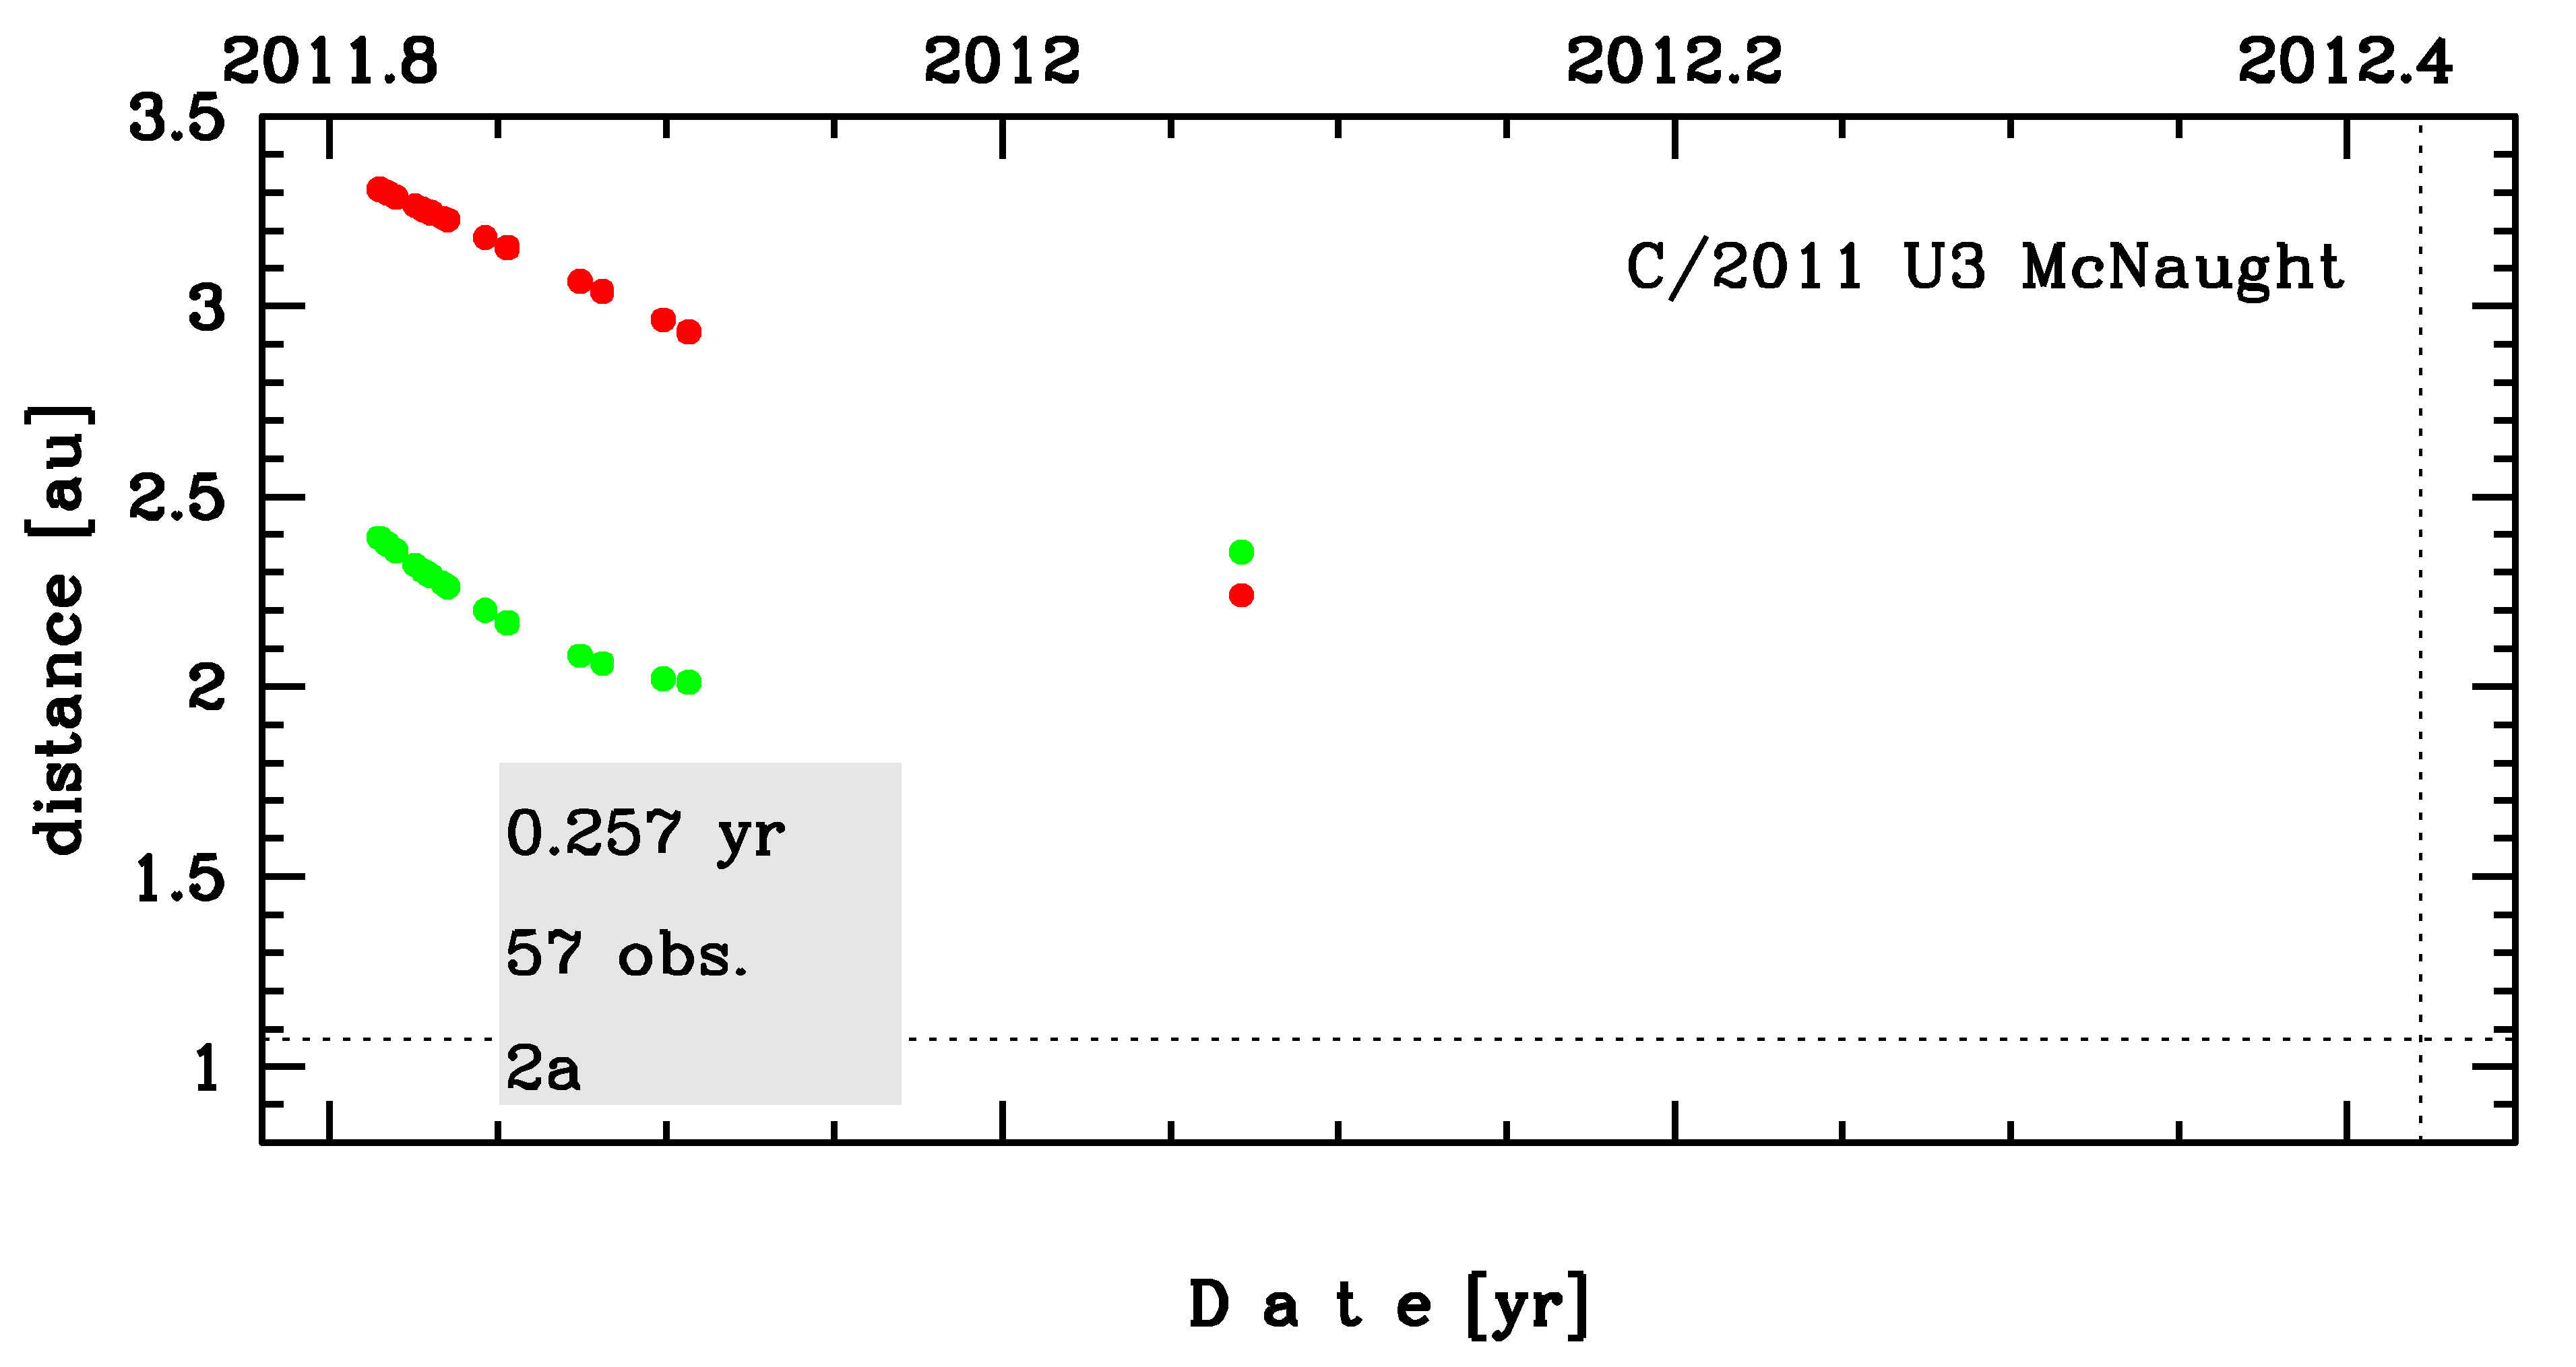
Time distribution of positional observations with corresponding heliocentric (red curve) and geocentric (green curve) distance at which they were taken. The horizontal dotted line shows the perihelion distance for a given comet whereas vertical dotted line — the moment of perihelion passage.
| previous_g orbit statistics, here only the Galactic tide has been included | ||
|---|---|---|
| no. of returning VCs in the swarm | 4628 | * |
| no. of escaping VCs in the swarm | 373 | |
| no. of hyperbolas among escaping VCs in the swarm | 115 | |
| previous reciprocal semi-major axis [10-6 au-1] | 31.86 – 65.53 – 104.74 | R |
| previous perihelion distance [au] | 0.096 – 0.75 – 8.4 | R |
| previous aphelion distance [103 au] | 19 – 31 – 63 | R |
| time interval to previous perihelion [Myr] | 0.93 – 1.9 – 5.5 | R |
| percentage of VCs with qprev < 10 | 91 | |
| percentage of VCs with 10 < qprev < 20 | 2 | |
| percentage of VCs with qprev > 20 | 7 | |