C/2012 S3 PANSTARRS
more info
Comet C/2012 S3 was discovered on 27 September 2012 with Pan-STARRS 1 telescope (Haleakala), that is 11 months before its perihelion passage. It was observed until 4 April 2014 (see picture).
C/2012 S3 had its closest approach to the Earth on 1 August 2013 (1.338 au), about a month before its perihelion passage.
Solutions given here are based on data spanning over 1.52 yr in a range of heliocentric distances: 4.25 au – 2.308 au (perihelion) – 3.30 au.
This Oort spike comet suffers rather small planetary perturbations during its passage through the planetary system that cause a tighter future orbit (see future barycentric orbits).
| solution description | ||
|---|---|---|
| number of observations | 749 | |
| data interval | 2012 09 27 – 2014 04 04 | |
| data type | significantly more measurements before perihelion (PRE+) | |
| data arc selection | entire data set (STD) | |
| range of heliocentric distances | 4.25 au – 2.31 au (perihelion) – 3.3 au | |
| type of model of motion | NS - non-gravitational orbits for standard g(r) | |
| data weighting | YES | |
| number of residuals | 1457 | |
| RMS [arcseconds] | 0.38 | |
| orbit quality class | 1a | |
| orbital elements (barycentric ecliptic J2000) | ||
|---|---|---|
| Epoch | 1712 10 13 | |
| perihelion date | 2013 08 31.09890265 | ± 0.00016023 |
| perihelion distance [au] | 2.31051786 | ± 0.00000104 |
| eccentricity | 0.99990686 | ± 0.00000269 |
| argument of perihelion [°] | 183.725955 | ± 0.000046 |
| ascending node [°] | 121.294734 | ± 0.000013 |
| inclination [°] | 112.894398 | ± 0.000013 |
| reciprocal semi-major axis [10-6 au-1] | 40.31 | ± 1.16 |
| file containing 5001 VCs swarm |
|---|
| 2012s3n5.bmi |
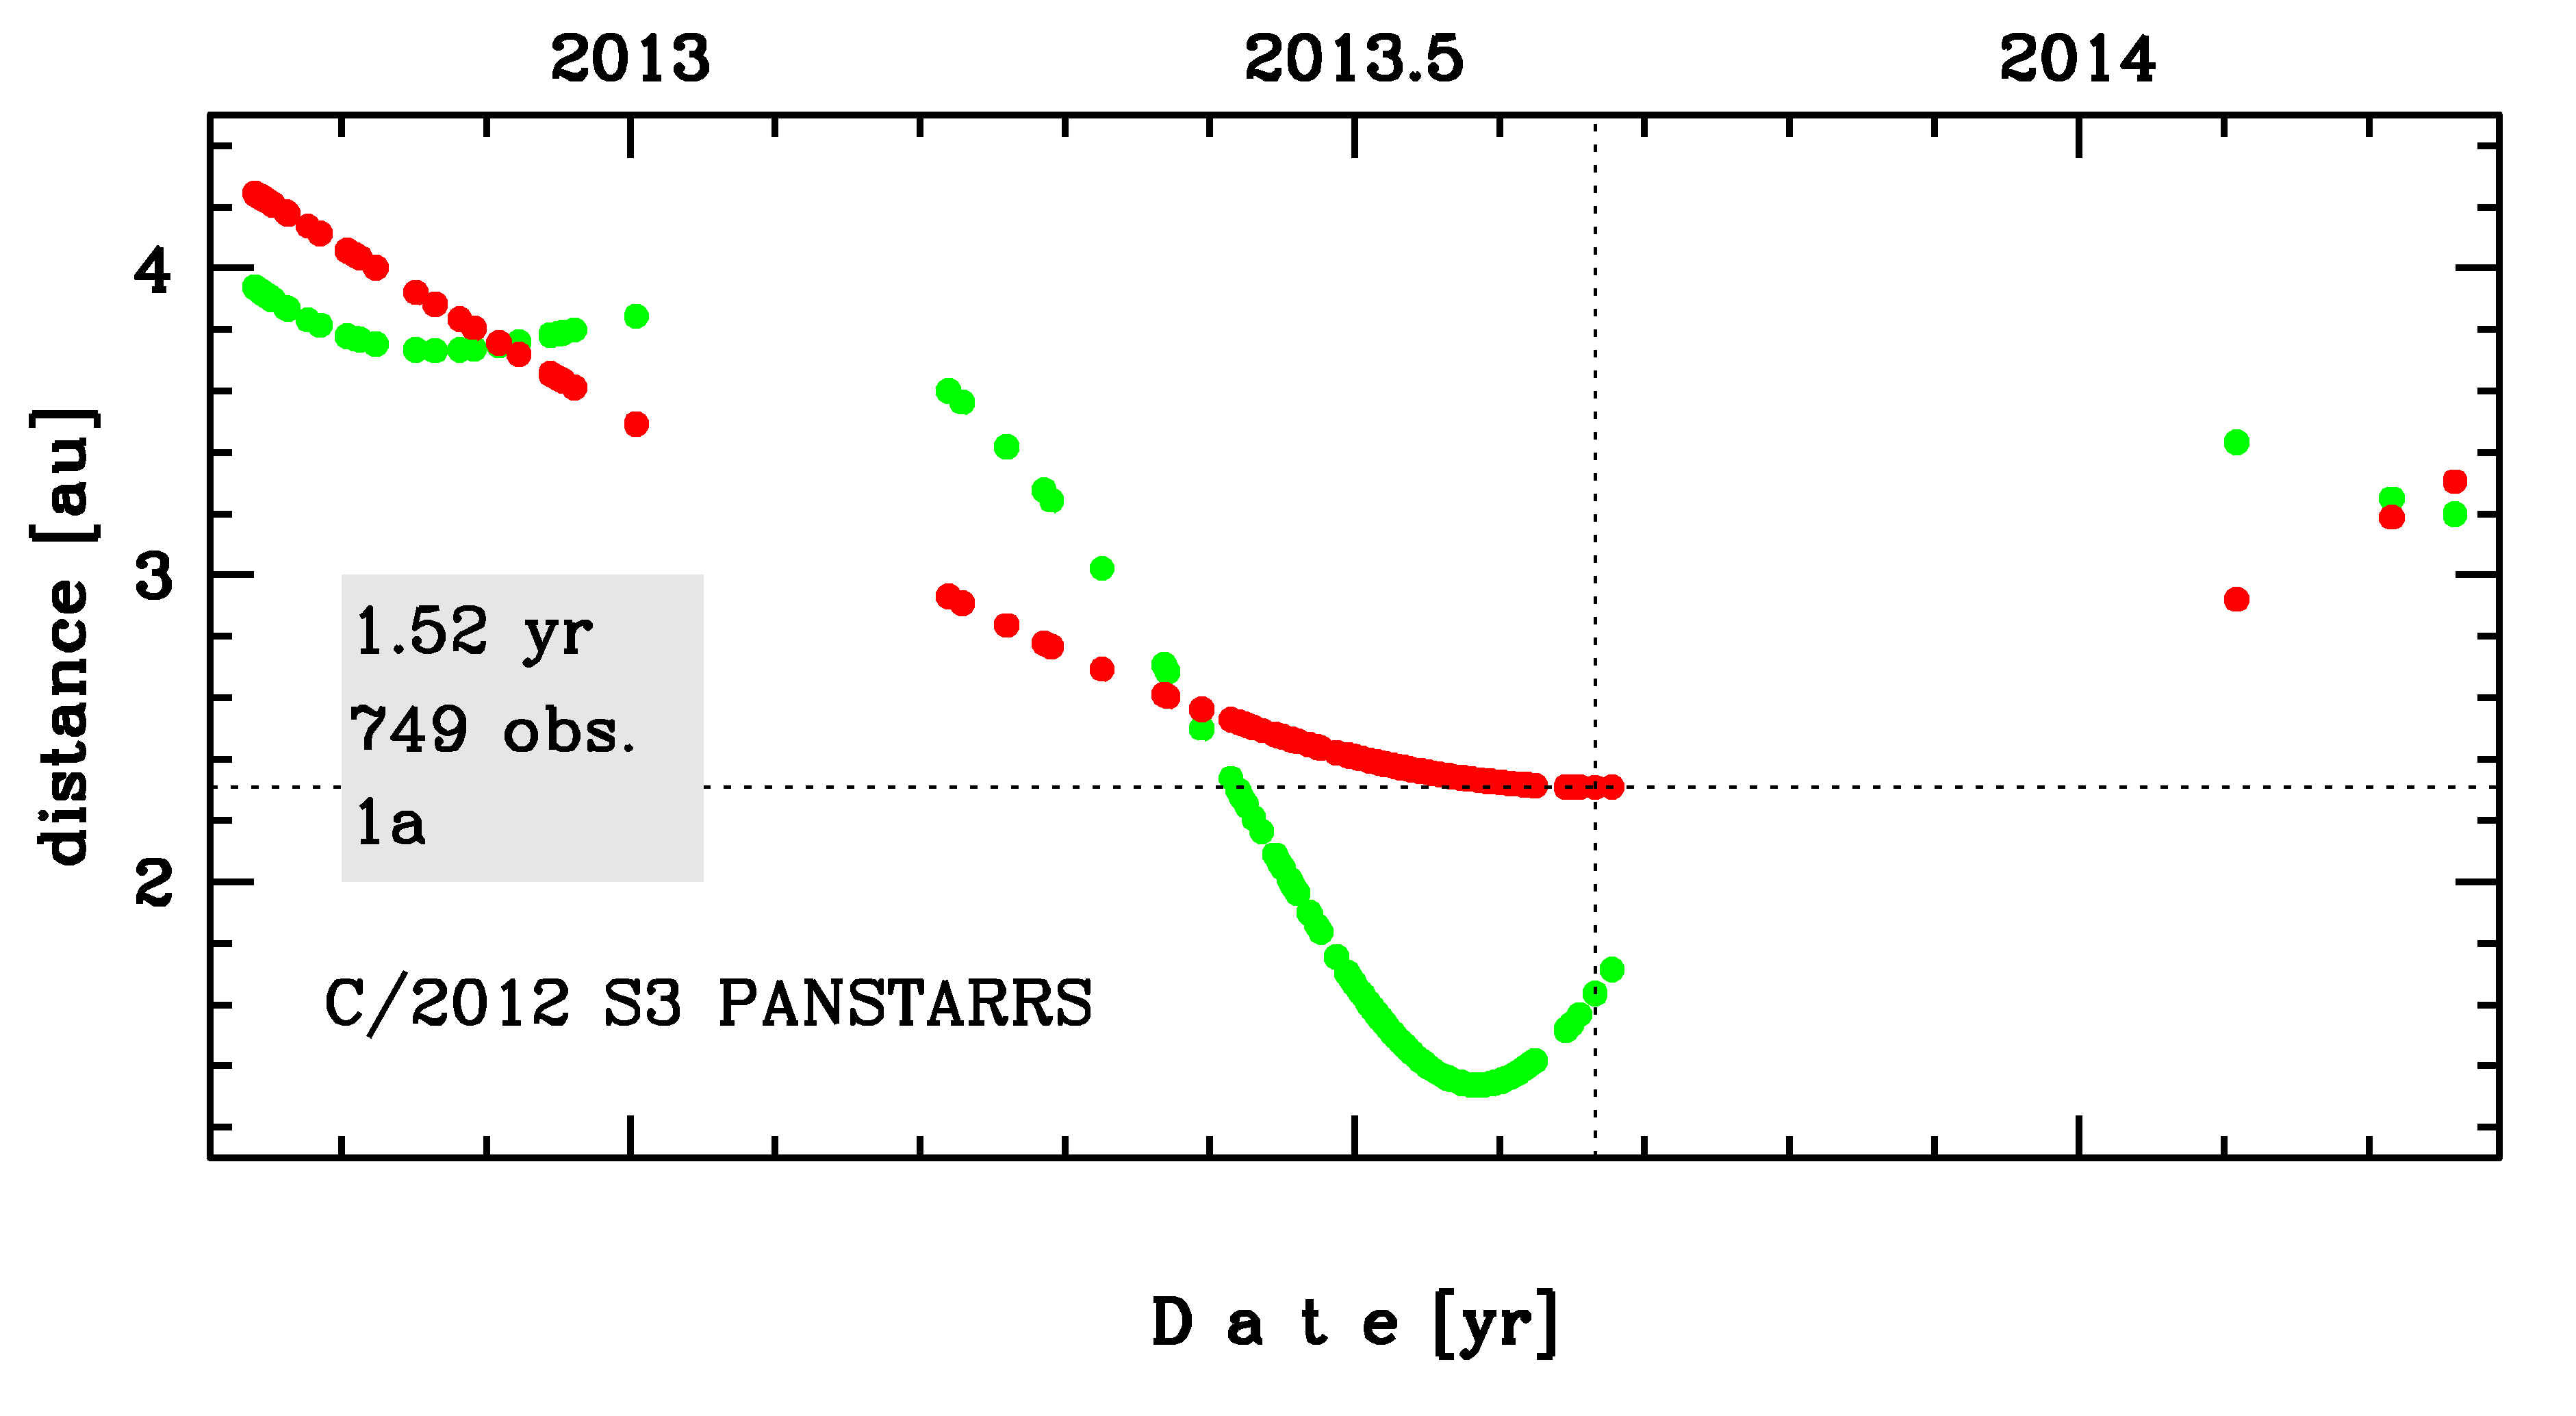
Time distribution of positional observations with corresponding heliocentric (red curve) and geocentric (green curve) distance at which they were taken. The horizontal dotted line shows the perihelion distance for a given comet whereas vertical dotted line — the moment of perihelion passage.
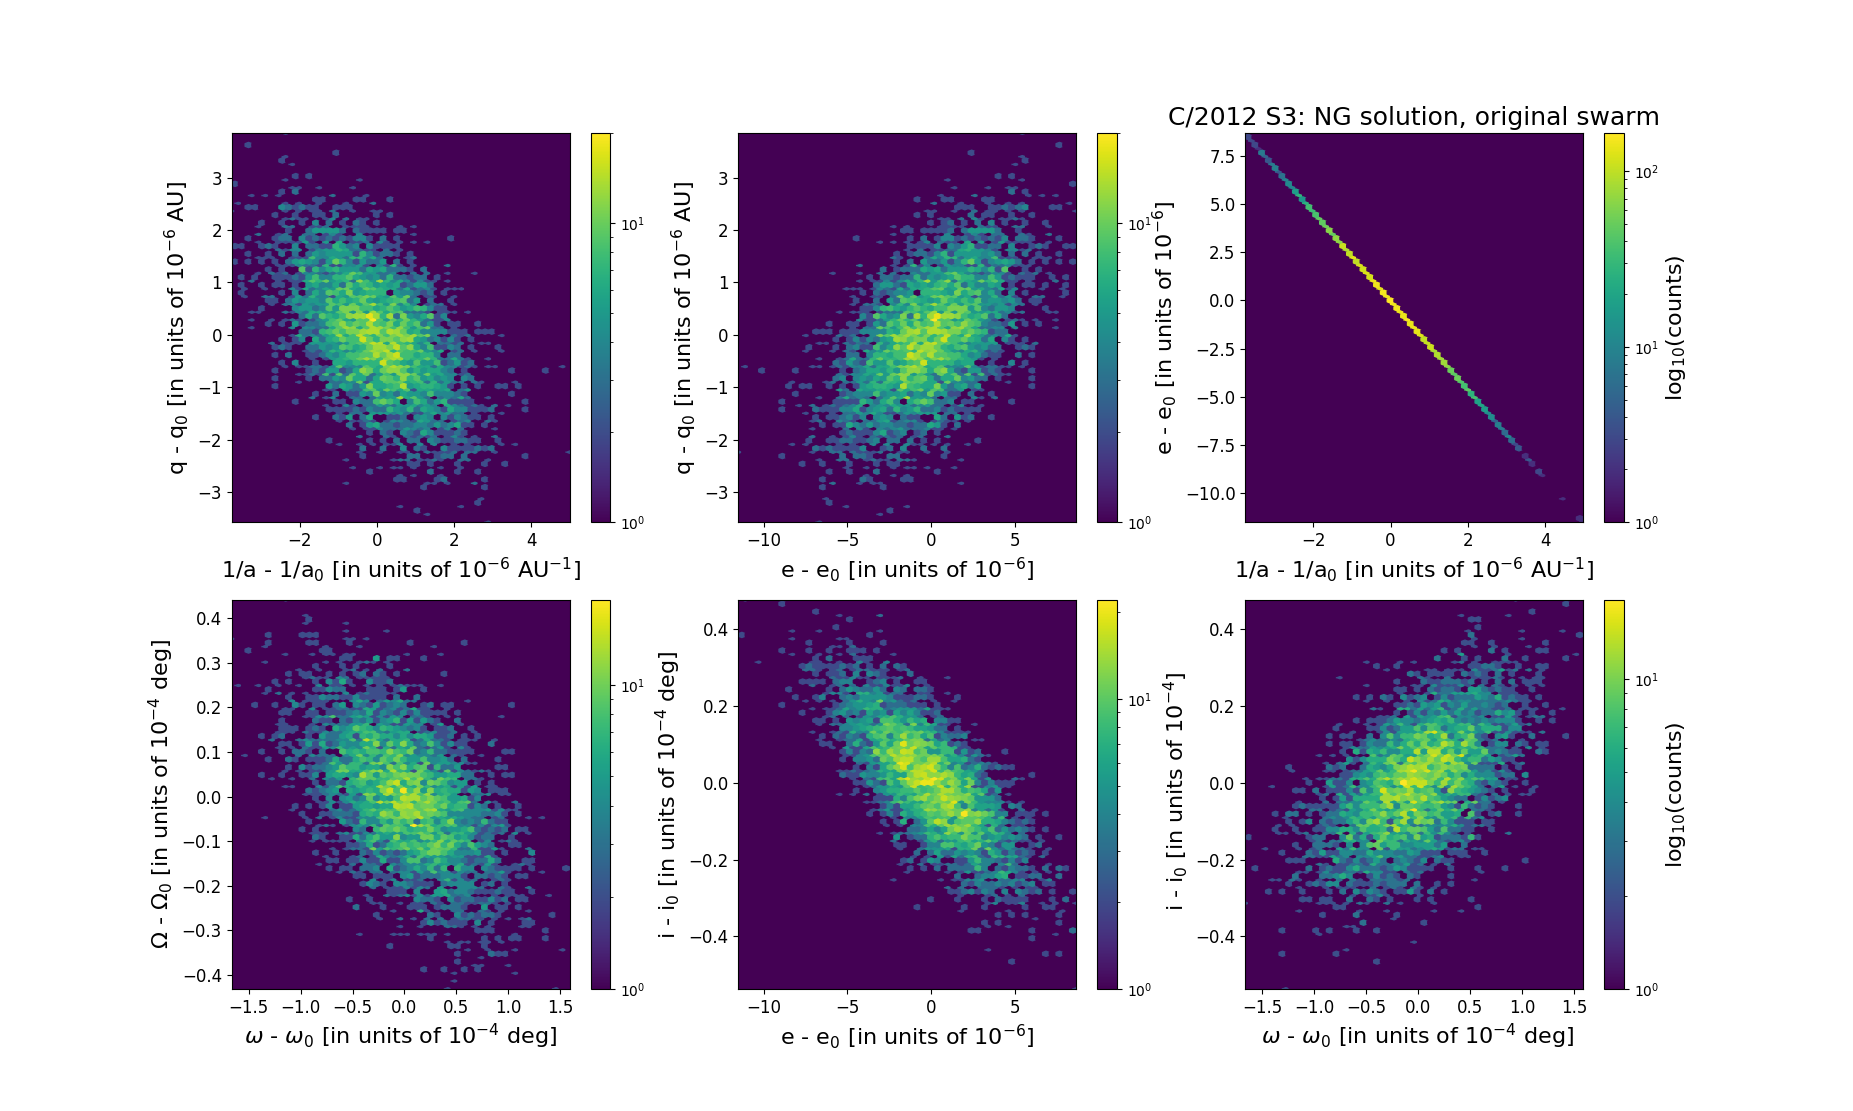
Six 2D-projections of the 6D space of original swarm including 5001 VCs. Each density map is given in logarithmic scale presented on the right in the individual panel.