C/2012 T5 Bressi
more info
Comet C/2012 T5 was discovered on 14 October 2012 by Terry H. Bressi (Spacewatch), that is more than 4 months before its perihelion passage. It was observed until 21 March 2013 (see picture).
C/2012 T5 had its closest approach to the Earth on 25 February 2013 (0.913 au), a day after its perihelion passage.
Comet was lost a month after perihelion passage and Sekanina (2019) concluded that this Oort Cloud comet did not survive the observed perihelion passage.
Original value of 1/a is significantly negative for solutions based on entire data set. The preferred solution (based on pre-perihelion data taken at larger heliocentric distances than 1.33au) gives also negative value of original 1/a; however, within its uncertainty of about 1.5 sigma this comet can came from the Oort Cloud.
See also Królikowska 2020.
| solution description | ||
|---|---|---|
| number of observations | 610 | |
| data interval | 2012 10 14 – 2012 12 31 | |
| data arc selection | data generally limited to pre-perihelion (PRE) | |
| range of heliocentric distances | 9.39 au – 1.33au | |
| detectability of NG effects in the comet's motion | comet lost close to perihelion or split comet | |
| type of model of motion | GR - gravitational orbit | |
| data weighting | YES | |
| number of residuals | 1208 | |
| RMS [arcseconds] | 0.75 | |
| orbit quality class | 2b | |
| orbital elements (barycentric ecliptic J2000) | ||
|---|---|---|
| Epoch | 1716 07 04 | |
| perihelion date | 2013 02 23.06792917 | ± 0.00243211 |
| perihelion distance [au] | 0.31306635 | ± 0.00000582 |
| eccentricity | 1.00000960 | ± 0.00000749 |
| argument of perihelion [°] | 318.568428 | ± 0.000784 |
| ascending node [°] | 230.639236 | ± 0.000115 |
| inclination [°] | 72.026528 | ± 0.00191 |
| reciprocal semi-major axis [10-6 au-1] | -30.67 | ± 23.91 |
| file containing 5001 VCs swarm |
|---|
| 2012t5pa.bmi |
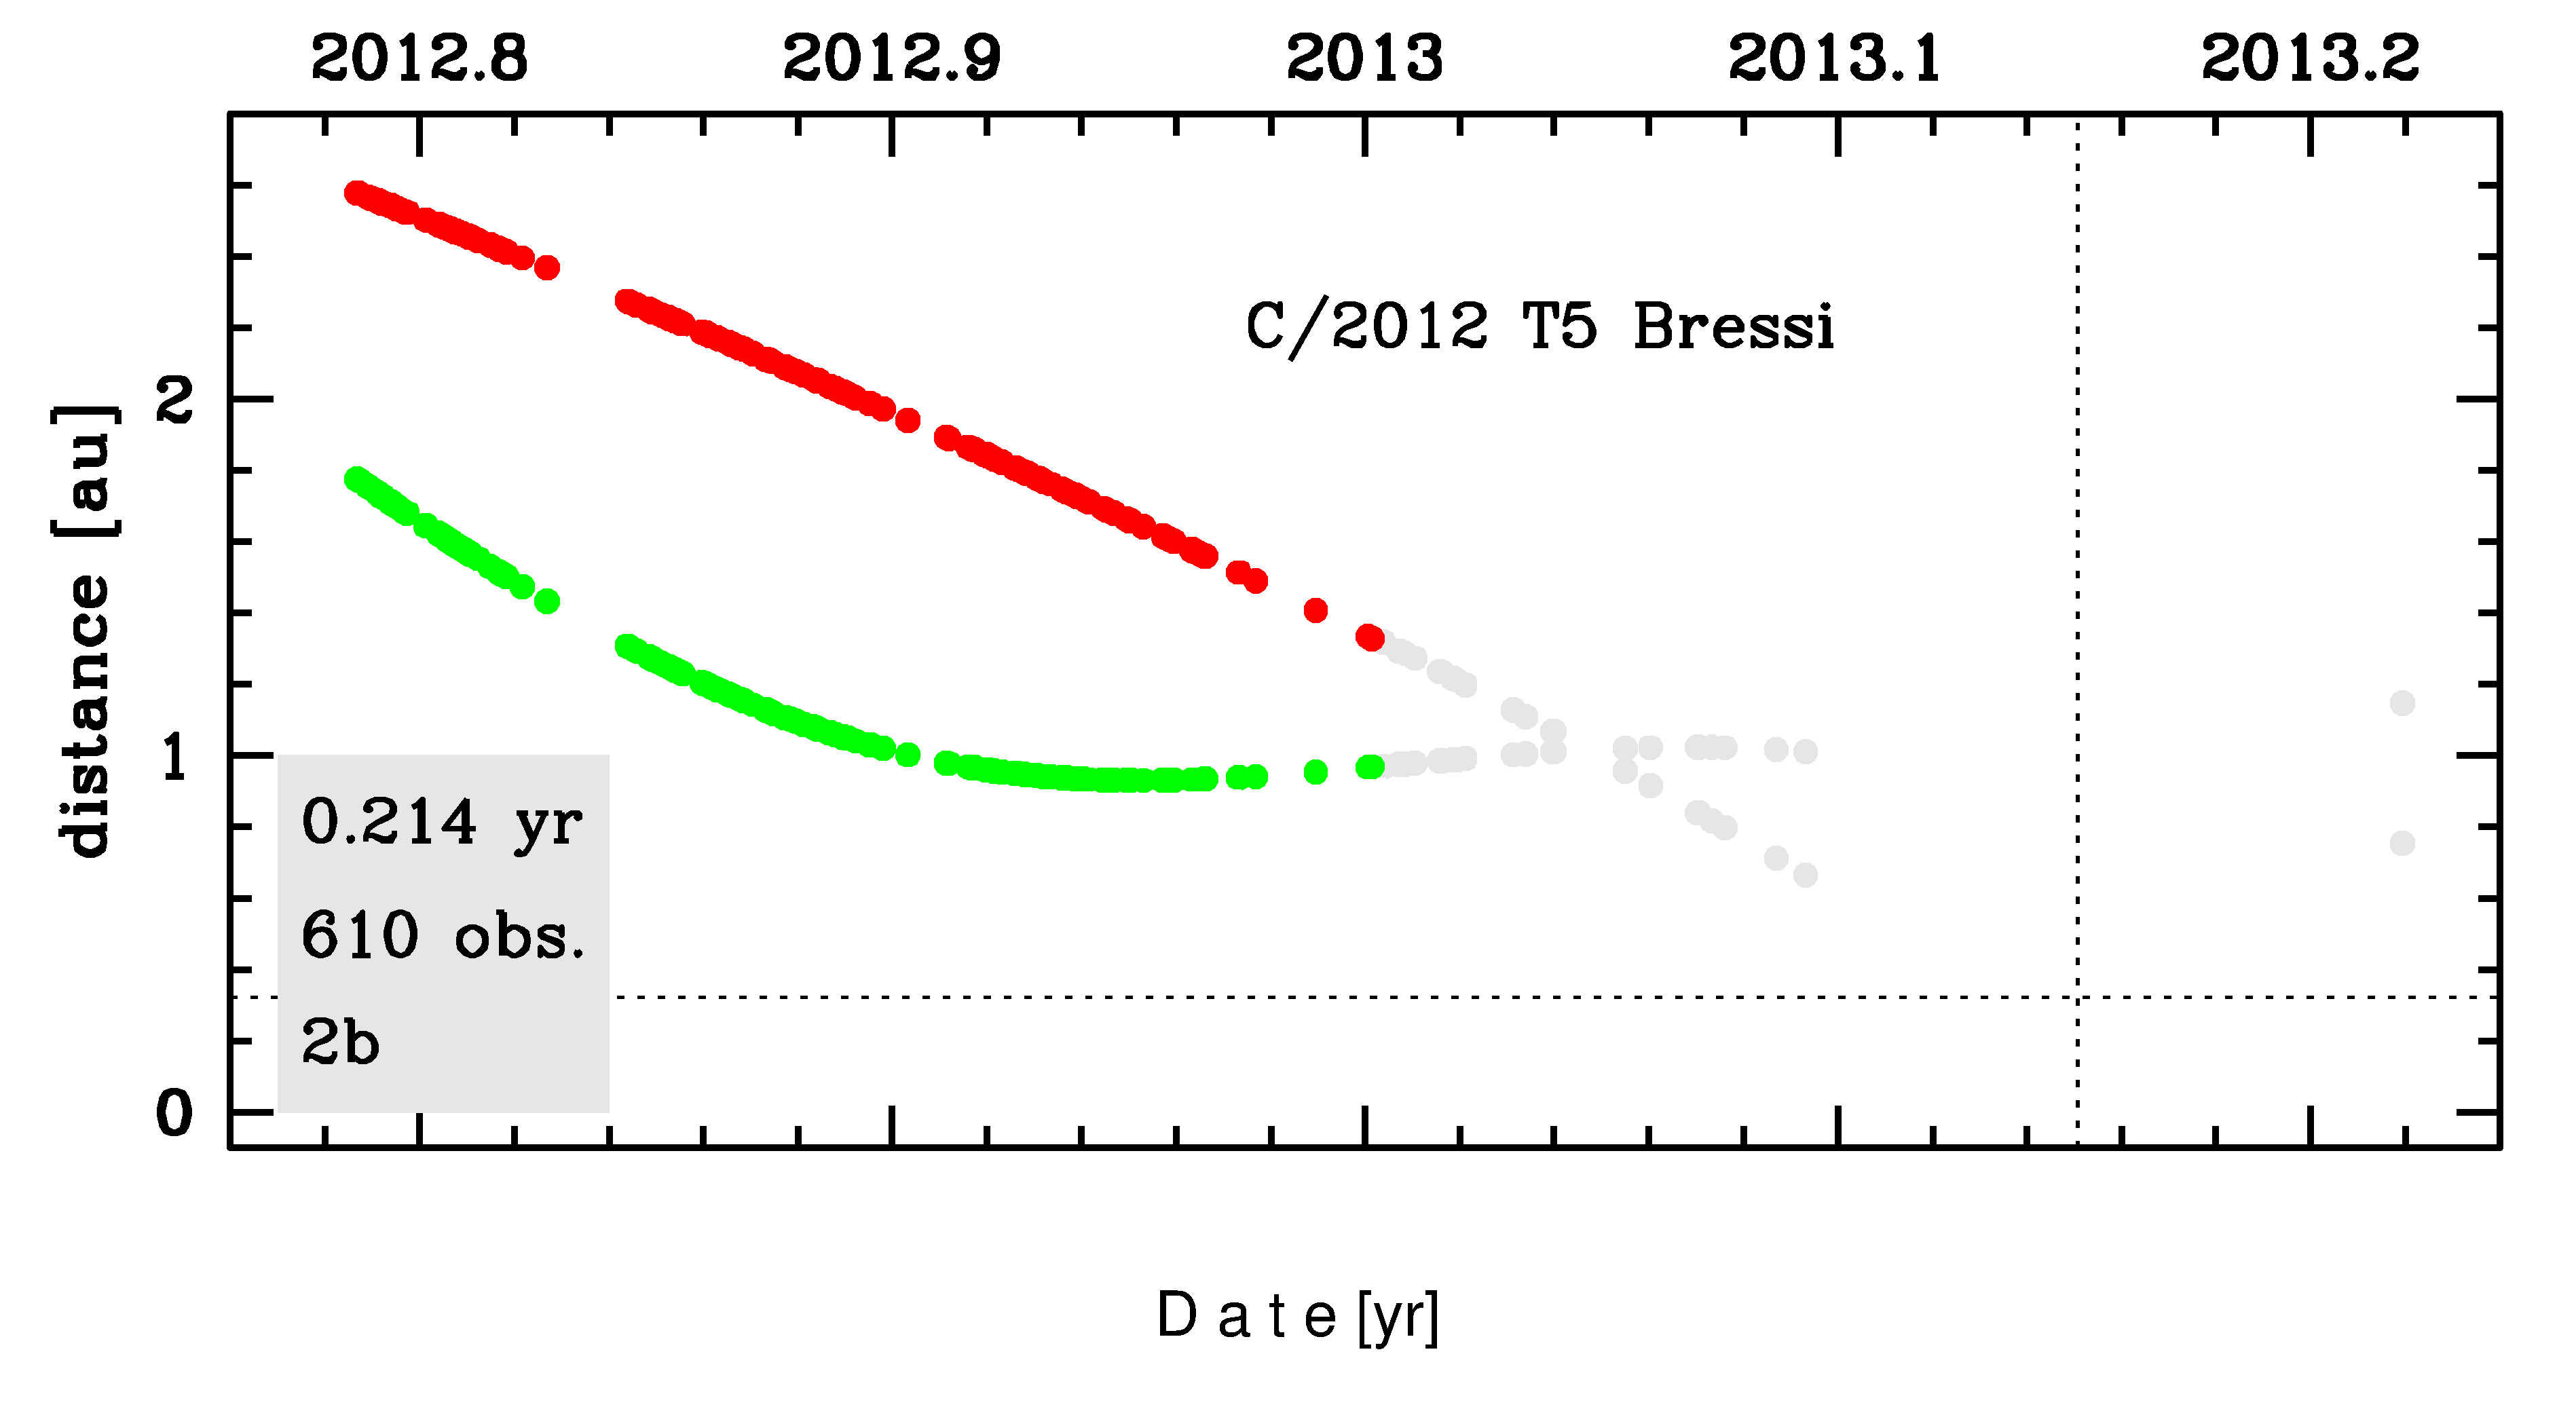
Time distribution of positional observations with corresponding heliocentric (red curve) and geocentric (green curve) distance at which they were taken. The horizontal dotted line shows the perihelion distance for a given comet whereas vertical dotted line — the moment of perihelion passage.
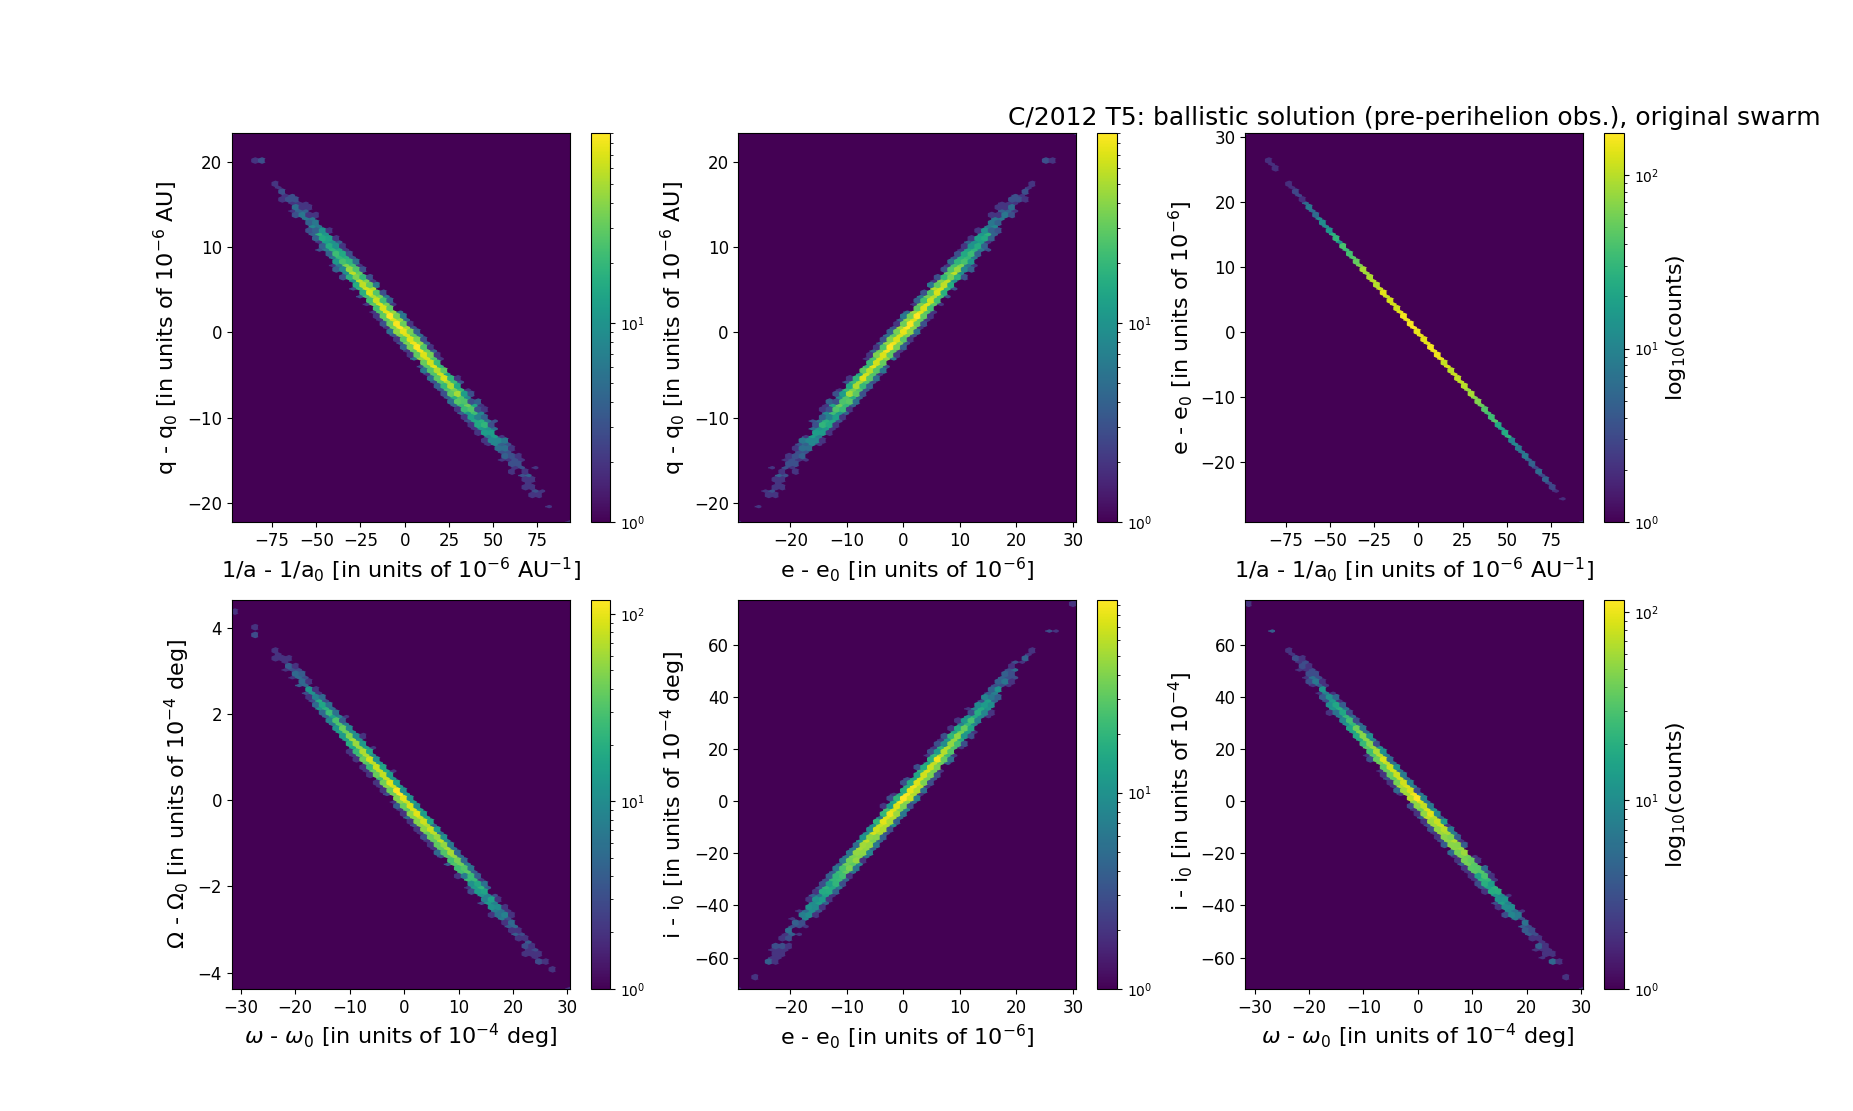
Six 2D-projections of the 6D space of original swarm including 5001 VCs. Each density map is given in logarithmic scale presented on the right in the individual panel.