C/1935 Q1 Van Biesbroeck
more info
Comet C/1935 Q1 was discovered on 21 August 1935, about 7.5 months before perihelion passage, and soon a few prediscovery images were found (taken at Union Observatory in South Africa) extending arc to 3 July 1935; comet was last seen on 26 January 1938 [Kronk, Cometography: Volume 4].
This comet made two close approaches to the Earth, on 4 August 1935 (3.70 au) and on 6 August 1936 (3.62 au).
Solution given here is based on data spanning over 2.30 yr in a range of heliocentric distances from 4.83 au through perihelion (4.04 au) to 6.06 au.
This Oort spike comet suffers small planetary perturbations during its passage through the planetary system; however, they lead to escape the comet from the solar system on a hiperbolic orbit (see future barycentric orbit).
More details in Królikowska et al. 2014 andKrólikowska and Dybczyński 2017.
| solution description | ||
|---|---|---|
| number of observations | 131 | |
| data interval | 1935 07 03 – 1937 11 12 | |
| data type | perihelion within the observation arc (FULL) | |
| data arc selection | entire data set (STD) | |
| range of heliocentric distances | 4.83 au – 4.04 au (perihelion) – 6.06 au | |
| detectability of NG effects in the comet's motion | NG effects not determinable | |
| type of model of motion | GR - gravitational orbit | |
| data weighting | YES | |
| number of residuals | 250 | |
| RMS [arcseconds] | 1.49 | |
| orbit quality class | 1a | |
| orbital elements (barycentric ecliptic J2000) | ||
|---|---|---|
| Epoch | 1632 09 22 | |
| perihelion date | 1936 05 11.11543500 | ± 0.00172400 |
| perihelion distance [au] | 4.03419814 | ± 0.00000987 |
| eccentricity | 0.99994692 | ± 0.00002094 |
| argument of perihelion [°] | 45.035086 | ± 0.000250 |
| ascending node [°] | 300.599583 | ± 0.000060 |
| inclination [°] | 66.129296 | ± 0.000051 |
| reciprocal semi-major axis [10-6 au-1] | 13.16 | ± 5.19 |
| file containing 5001 VCs swarm |
|---|
| 1935q1a5.bmi |
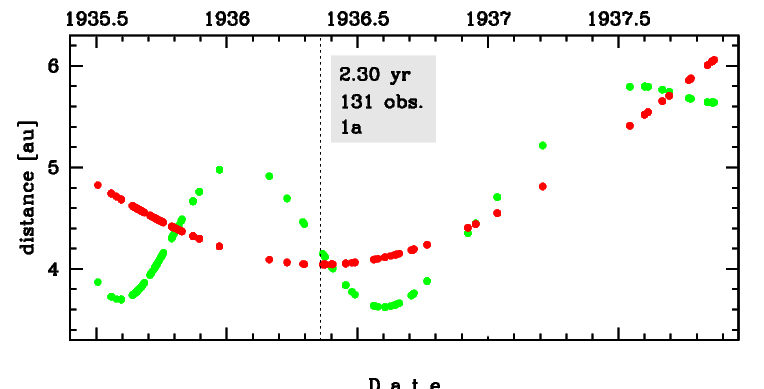
Time distribution of positional observations with corresponding heliocentric (red curve) and geocentric (green curve) distance at which they were taken. The horizontal dotted line shows the perihelion distance for a given comet whereas vertical dotted line — the moment of perihelion passage.
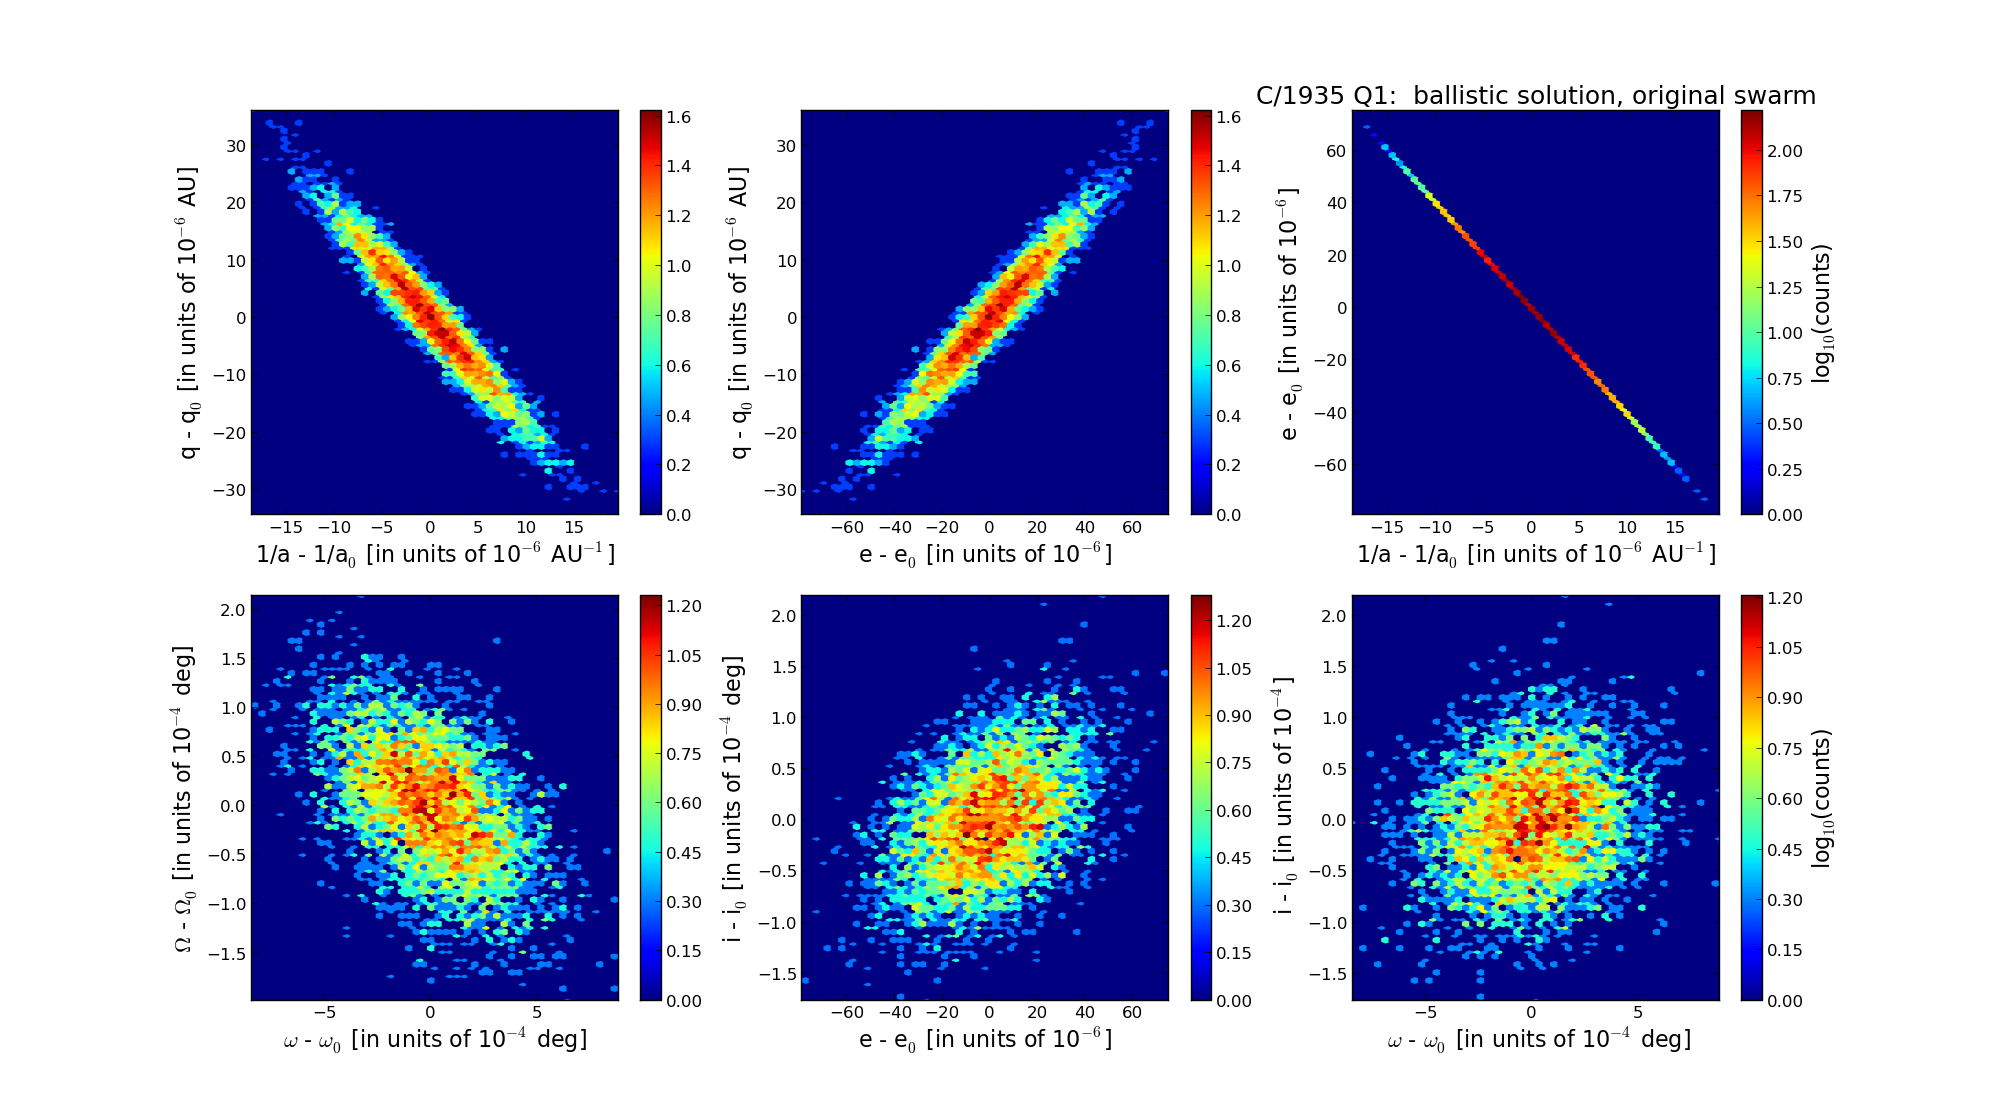
Six 2D-projections of the 6D space of original swarm including 5001 VCs. Each density map is given in logarithmic scale presented on the right in the individual panel.