C/1935 Q1 Van Biesbroeck
more info
Comet C/1935 Q1 was discovered on 21 August 1935, about 7.5 months before perihelion passage, and soon a few prediscovery images were found (taken at Union Observatory in South Africa) extending arc to 3 July 1935; comet was last seen on 26 January 1938 [Kronk, Cometography: Volume 4].
This comet made two close approaches to the Earth, on 4 August 1935 (3.70 au) and on 6 August 1936 (3.62 au).
Solution given here is based on data spanning over 2.30 yr in a range of heliocentric distances from 4.83 au through perihelion (4.04 au) to 6.06 au.
This Oort spike comet suffers small planetary perturbations during its passage through the planetary system; however, they lead to escape the comet from the solar system on a hiperbolic orbit (see future barycentric orbit).
More details in Królikowska et al. 2014 andKrólikowska and Dybczyński 2017.
| solution description | ||
|---|---|---|
| number of observations | 131 | |
| data interval | 1935 07 03 – 1937 11 12 | |
| data type | perihelion within the observation arc (FULL) | |
| data arc selection | entire data set (STD) | |
| range of heliocentric distances | 4.83 au – 4.04 au (perihelion) – 6.06 au | |
| detectability of NG effects in the comet's motion | NG effects not determinable | |
| type of model of motion | GR - gravitational orbit | |
| data weighting | YES | |
| number of residuals | 250 | |
| RMS [arcseconds] | 1.49 | |
| orbit quality class | 1a | |
| previous orbit statistics, both Galactic and stellar perturbations were taken into account | ||
|---|---|---|
| no. of returning VCs in the swarm | 1324 | |
| no. of escaping VCs in the swarm | 3677 | * |
| no. of hyperbolas among escaping VCs in the swarm | 28 | |
| previous reciprocal semi-major axis [10-6 au-1] | 6.45 – 12.97 – 19.57 | |
| previous perihelion distance [au] | 1280 – 1480 – 1580 | R |
| previous aphelion distance [103 au] | 100 – 150 – 300 | |
| time interval to previous perihelion [Myr] | 8.9 – 12 – 14 | R |
| percentage of VCs with qprev > 20 | 100 | |
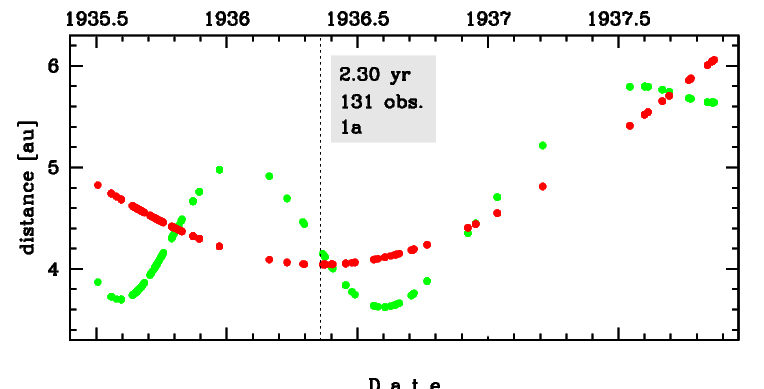
Time distribution of positional observations with corresponding heliocentric (red curve) and geocentric (green curve) distance at which they were taken. The horizontal dotted line shows the perihelion distance for a given comet whereas vertical dotted line — the moment of perihelion passage.
| previous_g orbit statistics, here only the Galactic tide has been included | ||
|---|---|---|
| no. of returning VCs in the swarm | 1312 | |
| no. of escaping VCs in the swarm | 3689 | * |
| no. of hyperbolas among escaping VCs in the swarm | 24 | |
| previous reciprocal semi-major axis [10-6 au-1] | 6.77 – 13.36 – 20.04 | |
| previous perihelion distance [au] | 40 – 150 – 320 | R |
| previous aphelion distance [103 au] | 100 – 150 – 290 | |
| time interval to previous perihelion [Myr] | 8.7 – 12 – 14 | R |
| percentage of VCs with 10 < qprev < 20 | 2 | |
| percentage of VCs with qprev > 20 | 98 | |