C/1976 U1 Lovas
more info
Comet C/1976 U1 was discovered on 27 October 1976, 3.7 months after its perihelion passage, and was last seen on 10 February 1978 [Kronk and Meyer, Cometography: Volume 5].
This comet made its closest approach to the Earth on 1 January 1977 (5.33 au), about 2 months after its discovery.
Solution given here is based on data spanning over 1.22 yr in a range of heliocentric distances from 5.94 au to 7.14 au.
This Oort spike comet suffers small planetary perturbations during its passage through the planetary system that lead to a more tight future orbit (see future barycentric orbit).
See also Królikowska 2014 and Królikowska and Dybczyński 2017.
| solution description | ||
|---|---|---|
| number of observations | 30 | |
| data interval | 1976 11 22 – 1978 02 10 | |
| data type | observed only after perihelion (POST) | |
| data arc selection | entire data set (STD) | |
| range of heliocentric distances | 5.94 au – 7.14au | |
| detectability of NG effects in the comet's motion | NG effects not determinable | |
| type of model of motion | GR - gravitational orbit | |
| data weighting | NO | |
| number of residuals | 60 | |
| RMS [arcseconds] | 1.69 | |
| orbit quality class | 1b | |
| orbital elements (barycentric ecliptic J2000) | ||
|---|---|---|
| Epoch | 2285 06 11 | |
| perihelion date | 1976 07 07.80035300 | ± 0.03600400 |
| perihelion distance [au] | 5.85826685 | ± 0.00014138 |
| eccentricity | 0.99884526 | ± 0.00012806 |
| argument of perihelion [°] | 118.887188 | ± 0.003900 |
| ascending node [°] | 286.007941 | ± 0.000292 |
| inclination [°] | 86.681367 | ± 0.000352 |
| reciprocal semi-major axis [10-6 au-1] | 197.11 | ± 21.86 |
| file containing 5001 VCs swarm |
|---|
| 1976u1a1.bpl |
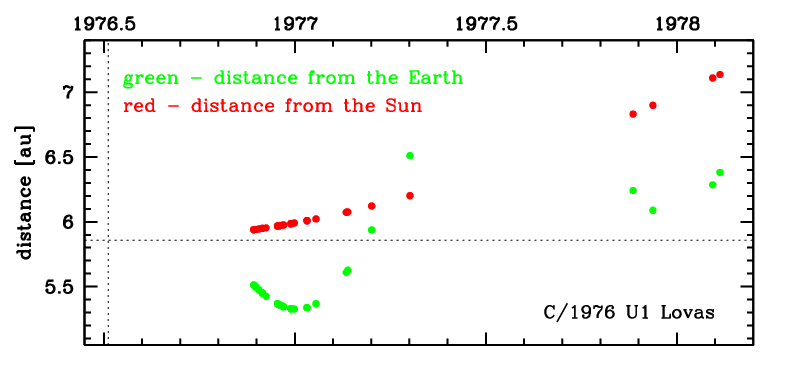
Time distribution of positional observations with corresponding heliocentric (red curve) and geocentric (green curve) distance at which they were taken. The horizontal dotted line shows the perihelion distance for a given comet whereas vertical dotted line — the moment of perihelion passage.
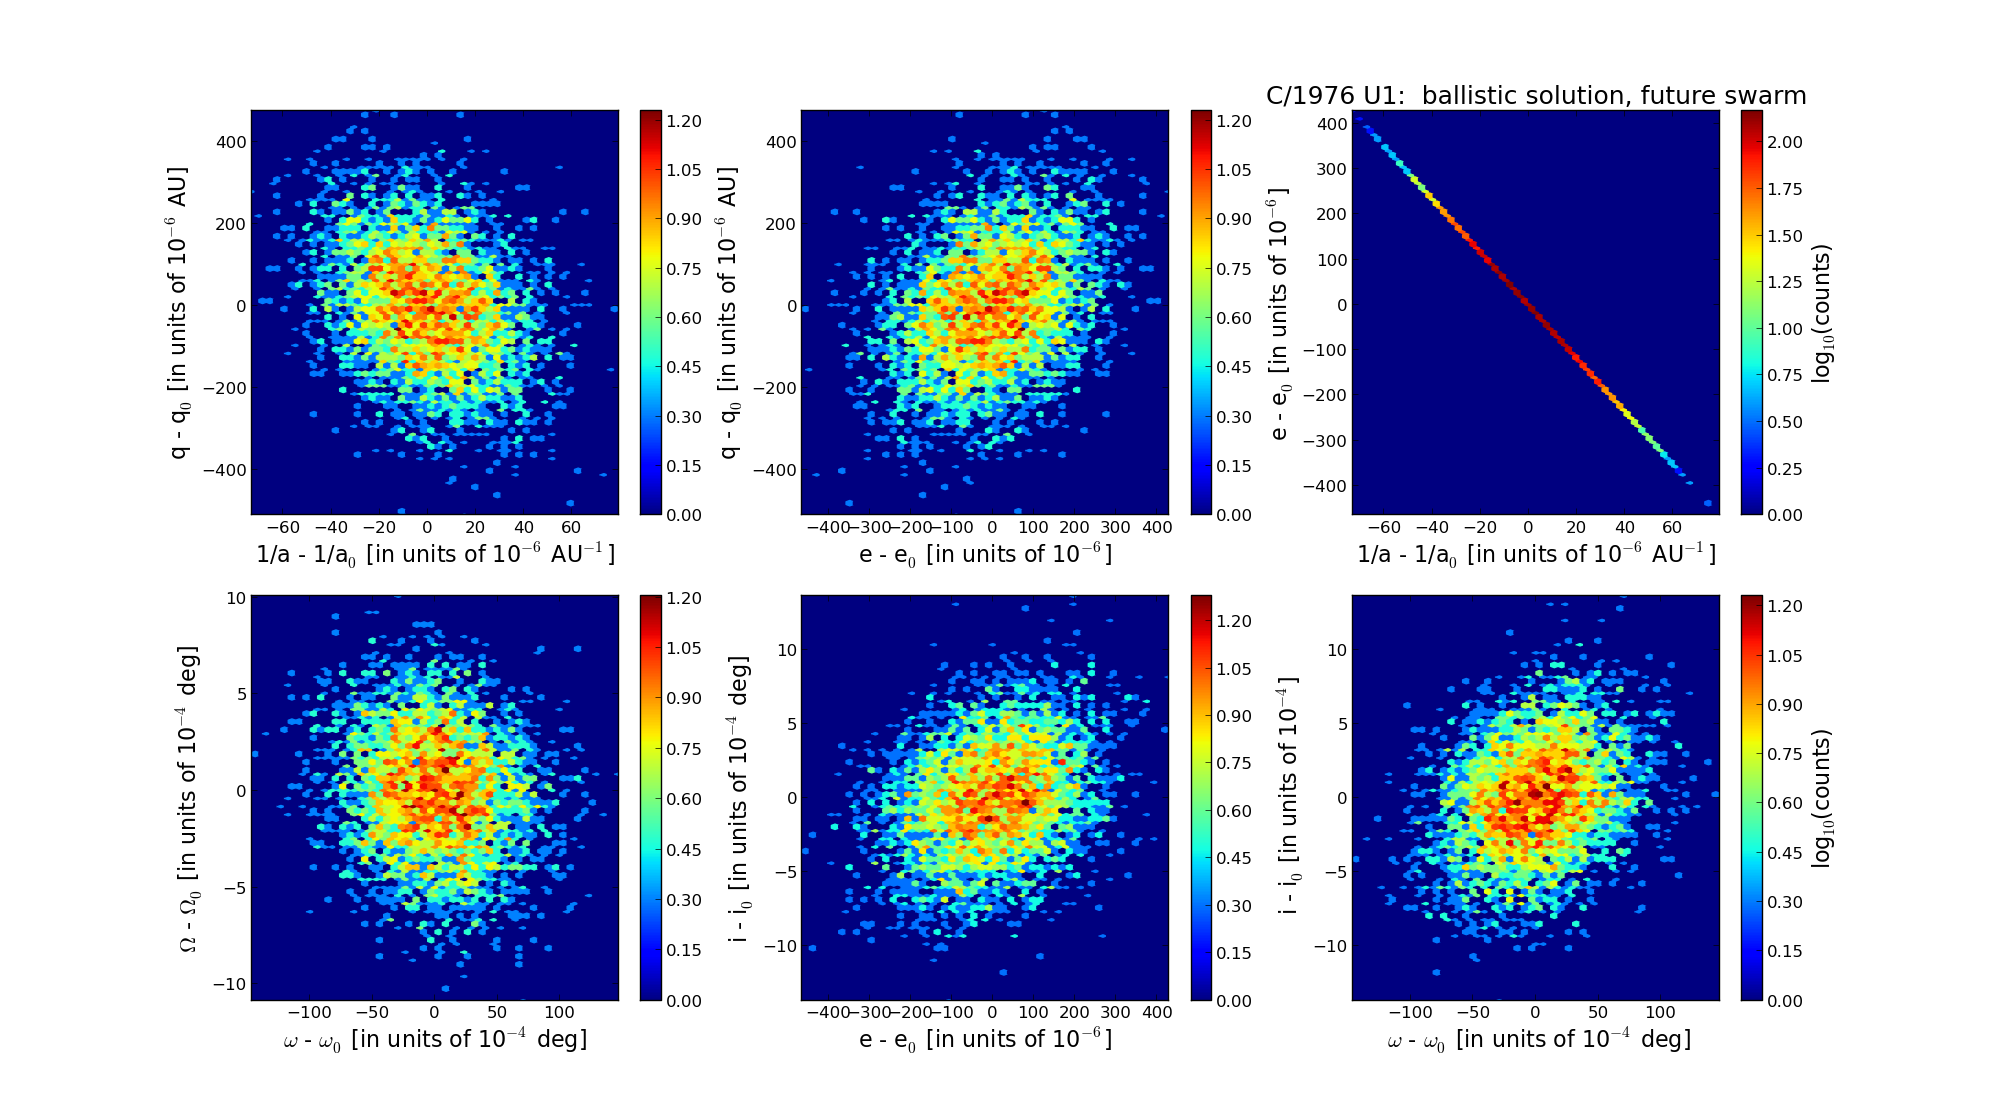
Six 2D-projections of the 6D space of future swarm including 5001 VCs. Each density map is given in logarithmic scale presented on the right in the individual panel.