C/1976 U1 Lovas
more info
Comet C/1976 U1 was discovered on 27 October 1976, 3.7 months after its perihelion passage, and was last seen on 10 February 1978 [Kronk and Meyer, Cometography: Volume 5].
This comet made its closest approach to the Earth on 1 January 1977 (5.33 au), about 2 months after its discovery.
Solution given here is based on data spanning over 1.22 yr in a range of heliocentric distances from 5.94 au to 7.14 au.
This Oort spike comet suffers small planetary perturbations during its passage through the planetary system that lead to a more tight future orbit (see future barycentric orbit).
See also Królikowska 2014 and Królikowska and Dybczyński 2017.
| solution description | ||
|---|---|---|
| number of observations | 30 | |
| data interval | 1976 11 22 – 1978 02 10 | |
| data type | observed only after perihelion (POST) | |
| data arc selection | entire data set (STD) | |
| range of heliocentric distances | 5.94 au – 7.14au | |
| detectability of NG effects in the comet's motion | NG effects not determinable | |
| type of model of motion | GR - gravitational orbit | |
| data weighting | NO | |
| number of residuals | 60 | |
| RMS [arcseconds] | 1.69 | |
| orbit quality class | 1b | |
| next orbit statistics, both Galactic and stellar perturbations were taken into account | ||
|---|---|---|
| no. of returning VCs in the swarm | 5001 | * |
| no. of escaping VCs in the swarm | 0 | |
| no. of hyperbolas among escaping VCs in the swarm | 0 | |
| next reciprocal semi-major axis [10-6 au-1] | 169.31 – 196.90 – 225.80 | |
| next perihelion distance [au] | 5.8576 – 5.8616 – 5.8688 | |
| next aphelion distance [103 au] | 8.9 – 10 – 12 | |
| time interval to next perihelion [Myr] | 0.29 – 0.36 – 0.45 | |
| percentage of VCs with qnext < 10 | 100 | |
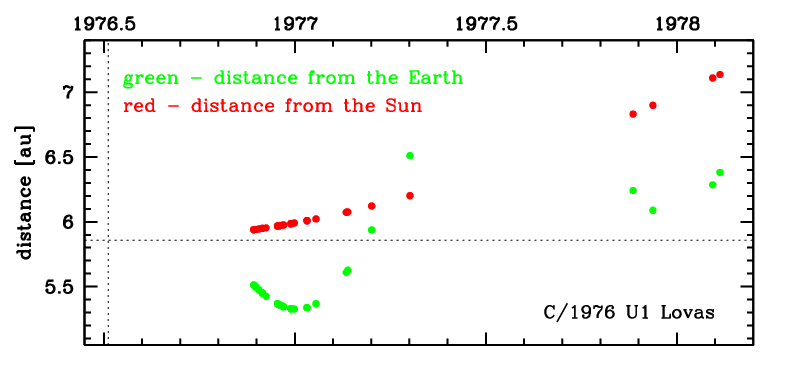
Time distribution of positional observations with corresponding heliocentric (red curve) and geocentric (green curve) distance at which they were taken. The horizontal dotted line shows the perihelion distance for a given comet whereas vertical dotted line — the moment of perihelion passage.
| next_g orbit statistics, here only the Galactic tide has been included | ||
|---|---|---|
| no. of returning VCs in the swarm | 5001 | * |
| no. of escaping VCs in the swarm | 0 | |
| no. of hyperbolas among escaping VCs in the swarm | 0 | |
| next reciprocal semi-major axis [10-6 au-1] | 169.29 – 196.88 – 225.78 | |
| next perihelion distance [au] | 5.8645 – 5.8685 – 5.8757 | |
| next aphelion distance [103 au] | 8.9 – 10 – 12 | |
| time interval to next perihelion [Myr] | 0.29 – 0.36 – 0.45 | |
| percentage of VCs with qnext < 10 | 100 | |