C/2010 L3 Catalina
more info
Comet C/2010 L3 was discovered on 15 June 2010 in a course of Catalina Sky Survey, and next rarely observed 2.8 yr during four oppositions in a range of heliocentric distances: 9.92 au – 9.883 au (perihelion) – 11.0 au. At the moment of discovery, it was five months before perihelion passage (see figure).
Comet had its closest approach to the Earth on 14 May 2011 (9.293 au, six months after perihelion).
This comet suffers small planetary perturbations during its passage through the planetary system that lead to a less tight future orbit with semimjor axis larger than 10000 au (see future barycentric orbit).
See also Królikowska and Dybczyński 2017.
| solution description | ||
|---|---|---|
| number of observations | 123 | |
| data interval | 2010 06 15 – 2013 04 08 | |
| data type | perihelion within the observation arc (FULL) | |
| data arc selection | entire data set (STD) | |
| range of heliocentric distances | 9.92 au – 9.88 au (perihelion) – 11 au | |
| detectability of NG effects in the comet's motion | NG effects not determinable | |
| type of model of motion | GR - gravitational orbit | |
| data weighting | YES | |
| number of residuals | 245 | |
| RMS [arcseconds] | 0.39 | |
| orbit quality class | 1a | |
| previous orbit statistics, both Galactic and stellar perturbations were taken into account | ||
|---|---|---|
| no. of returning VCs in the swarm | 5001 | * |
| no. of escaping VCs in the swarm | 0 | |
| no. of hyperbolas among escaping VCs in the swarm | 0 | |
| previous reciprocal semi-major axis [10-6 au-1] | 170.04 – 172.77 – 175.48 | |
| previous perihelion distance [au] | 9.9088 – 9.9102 – 9.9118 | |
| previous aphelion distance [103 au] | 11.4 – 11.6 – 11.8 | |
| time interval to previous perihelion [Myr] | 0.43 – 0.44 – 0.45 | |
| percentage of VCs with qprev < 10 | 100 | |
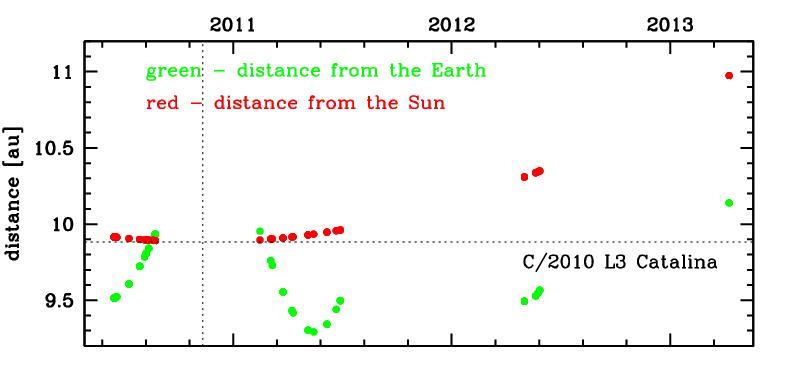
Time distribution of positional observations with corresponding heliocentric (red curve) and geocentric (green curve) distance at which they were taken. The horizontal dotted line shows the perihelion distance for a given comet whereas vertical dotted line — the moment of perihelion passage.
| previous_g orbit statistics, here only the Galactic tide has been included | ||
|---|---|---|
| no. of returning VCs in the swarm | 5001 | * |
| no. of escaping VCs in the swarm | 0 | |
| no. of hyperbolas among escaping VCs in the swarm | 0 | |
| previous reciprocal semi-major axis [10-6 au-1] | 170.04 – 172.77 – 175.48 | |
| previous perihelion distance [au] | 9.9055 – 9.9068 – 9.9082 | |
| previous aphelion distance [103 au] | 11.4 – 11.6 – 11.8 | |
| time interval to previous perihelion [Myr] | 0.43 – 0.44 – 0.45 | |
| percentage of VCs with qprev < 10 | 100 | |