C/2014 OE4 PANSTARRS
more info
Comet C/2014 OE4 was discovered on 26 July 2014 with Pan-STARRS 1 telescope (Haleakala), that is 2.4 yr before its perihelion passage; its cometary nature was soon recognised. Next, this comet was found on earlier images taken on several occasion by Pan-STARRS 1, Mount Lemmon Survey and Steward Observatory (Kitt Peak-Spacewatch survey), reaching back to 8 May 2014. This comet was observed until mid-January of 2020.
Comet had its closest approach to the Earth on 1 June 2016 (5.755 au), about six months before its perihelion passage.
Solution given here is based on data spanning over 5.71 yr in a range of heliocentric distances: 8.86 au – 6.253 au (perihelion) – 7.84 au.
This Oort spike comet suffers slight planetary perturbations during its passage through the planetary system; these perturbations lead to a more tight future orbit with a semimajor axis larger than 10,000 au (see future barycentric orbits).
| solution description | ||
|---|---|---|
| number of observations | 1805 | |
| data interval | 2014 05 08 – 2020 01 21 | |
| data type | perihelion within the observation arc (FULL) | |
| data arc selection | entire data set (STD) | |
| range of heliocentric distances | 8.86 au – 6.24 au (perihelion) – 7.84 au | |
| detectability of NG effects in the comet's motion | NG effects not determinable | |
| type of model of motion | GR - gravitational orbit | |
| data weighting | YES | |
| number of residuals | 3557 | |
| RMS [arcseconds] | 0.36 | |
| orbit quality class | 1a+ | |
| previous orbit statistics, both Galactic and stellar perturbations were taken into account | ||
|---|---|---|
| no. of returning VCs in the swarm | 5001 | * |
| no. of escaping VCs in the swarm | 0 | |
| no. of hyperbolas among escaping VCs in the swarm | 0 | |
| previous reciprocal semi-major axis [10-6 au-1] | 36.92 – 37.03 – 37.20 | |
| previous perihelion distance [au] | 491 – 502 – 514 | |
| previous aphelion distance [103 au] | 53.27 – 53.51 – 53.65 | |
| time interval to previous perihelion [Myr] | 3.87 – 3.905 – 3.94 | |
| percentage of VCs with qprev > 20 | 100 | |
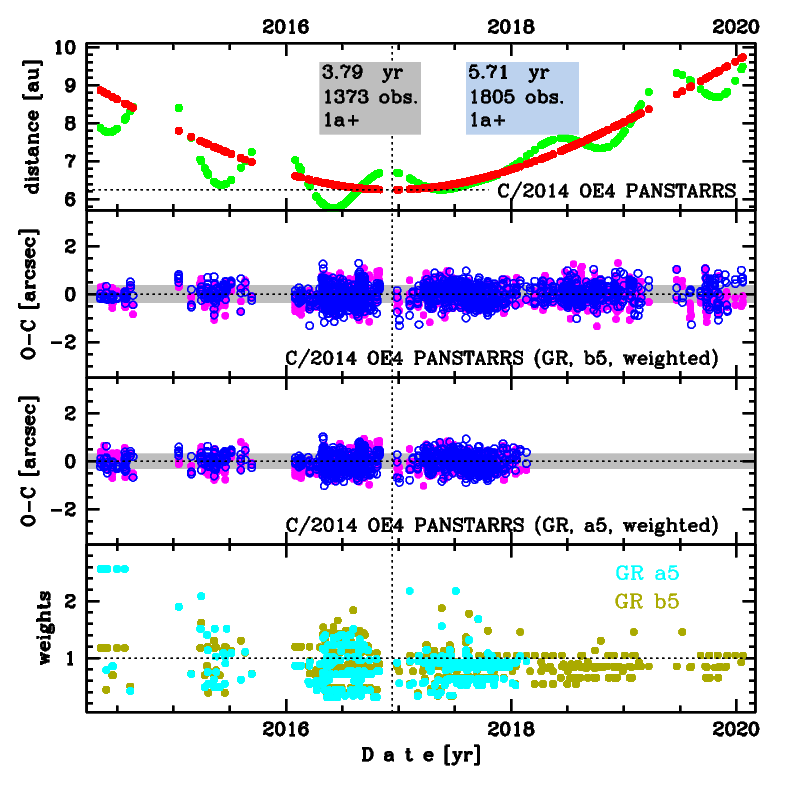
Upper panel: Time distribution of positional observations with corresponding heliocentric (red curve) and geocentric (green curve) distance at which they were taken. The horizontal dotted line shows the perihelion distance for a given comet whereas vertical dotted line — the moment of perihelion passage.
Middle panel(s): O-C diagram for a given solution (sometimes in comparison to another solution available in CODE), where residuals in right ascension are shown using magenta dots and in declination by blue open circles.
Lowest panel: Relative weights for a given data set(s).
Middle panel(s): O-C diagram for a given solution (sometimes in comparison to another solution available in CODE), where residuals in right ascension are shown using magenta dots and in declination by blue open circles.
Lowest panel: Relative weights for a given data set(s).
| previous_g orbit statistics, here only the Galactic tide has been included | ||
|---|---|---|
| no. of returning VCs in the swarm | 5001 | * |
| no. of escaping VCs in the swarm | 0 | |
| no. of hyperbolas among escaping VCs in the swarm | 0 | |
| previous reciprocal semi-major axis [10-6 au-1] | 38.99 – 39.25 – 39.51 | |
| previous perihelion distance [au] | 9.08 – 9.22 – 9.36 | |
| previous aphelion distance [103 au] | 50.61 – 50.95 – 51.29 | |
| time interval to previous perihelion [Myr] | 3.998 – 4.037 – 4.077 | |
| percentage of VCs with qprev < 10 | 100 | |