C/2015 X7 ATLAS
more info
Comet C/2015 X7 was discovered on 12 December 2015 by Asteroid Terrestrial-impact Last Alert System (ATLAS) Team, that is about 7.5 months before its perihelion passage. Some prediscovery images of this comet were found: taken on 28 January 2015 by Pan-STARRS 1, Haleakala. This comet was observed until 16 June 2017.
Comet had its closest approach to the Earth on 8 February 2017 (5.909 au); about 6 months after its perihelion passage.
Solutions given here are based on data spanning over 2.38 yr in a range of heliocentric distances: 5.95 au – 3.685 au (perihelion) – 4.64 au.
This Oort spike comet suffers small planetary perturbations during its passage through the planetary system that lead to a more tight future orbit with a semimajor axis of about 5,000 au (see future barycentric orbits).
| solution description | ||
|---|---|---|
| number of observations | 628 | |
| data interval | 2015 01 28 – 2017 06 16 | |
| data type | perihelion within the observation arc (FULL) | |
| data arc selection | entire data set (STD) | |
| range of heliocentric distances | 5.95 au – 3.69 au (perihelion) – 4.64 au | |
| type of model of motion | NC - non-gravitational orbits for symmetric CO-g(r)-like function | |
| data weighting | YES | |
| number of residuals | 1244 | |
| RMS [arcseconds] | 0.43 | |
| orbit quality class | 1a+ | |
| previous orbit statistics, both Galactic and stellar perturbations were taken into account | ||
|---|---|---|
| no. of returning VCs in the swarm | 5001 | * |
| no. of escaping VCs in the swarm | 0 | |
| no. of hyperbolas among escaping VCs in the swarm | 0 | |
| previous reciprocal semi-major axis [10-6 au-1] | 28.02 – 30.48 – 32.91 | |
| previous perihelion distance [au] | 1700 – 2000 – 2400 | |
| previous aphelion distance [103 au] | 59.1 – 63.6 – 69 | |
| time interval to previous perihelion [Myr] | 5 – 5.7 – 6.5 | |
| percentage of VCs with qprev > 20 | 100 | |
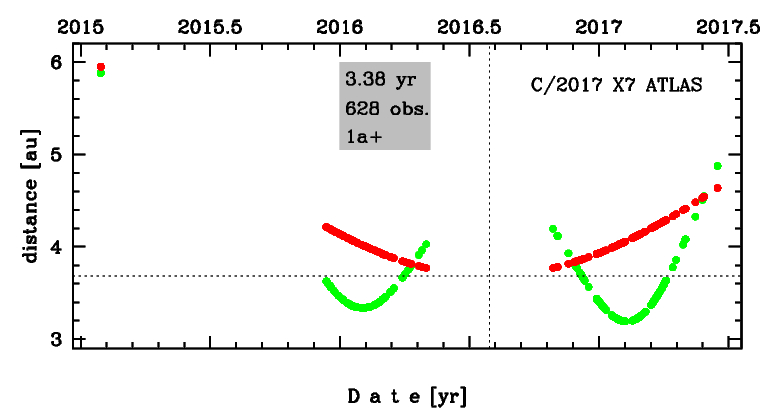
Time distribution of positional observations with corresponding heliocentric (red curve) and geocentric (green curve) distance at which they were taken. The horizontal dotted line shows the perihelion distance for a given comet whereas vertical dotted line — the moment of perihelion passage.
| previous_g orbit statistics, here only the Galactic tide has been included | ||
|---|---|---|
| no. of returning VCs in the swarm | 5001 | * |
| no. of escaping VCs in the swarm | 0 | |
| no. of hyperbolas among escaping VCs in the swarm | 0 | |
| previous reciprocal semi-major axis [10-6 au-1] | 28.30 – 30.95 – 33.61 | |
| previous perihelion distance [au] | 27 – 40 – 64 | |
| previous aphelion distance [103 au] | 59.5 – 64.6 – 70.6 | |
| time interval to previous perihelion [Myr] | 5.1 – 5.8 – 6.6 | |
| percentage of VCs with 10 < qprev < 20 | 1 | |
| percentage of VCs with qprev > 20 | 99 | |