C/2016 A1 PANSTARRS
more info
Comet C/2016 A1 was discovered on 1 January 2016 with Pan-STARRS 1 telescope (Haleakala), that is about almost 2 yr before its perihelion passage, and was next observed until 15 February 2020.
Comet had its closest approach to the Earth on 17 January 2018 (4.397 au); about 2 months after its perihelion passage.
Solutions given here are based on data spanning over 4.12 yr in a range of heliocentric distances: 7.31 au 5.328 au (perihelion) – 7.90 au.
This Oort spike comet suffers small planetary perturbations during its passage through the planetary system that lead to a more tight future orbit (see future barycentric orbit).
See also Królikowska and Dones 2023.
| solution description | ||
|---|---|---|
| number of observations | 1648 | |
| data interval | 2016 01 01 – 2018 05 17 | |
| data arc selection | data generally limited to pre-perihelion (PRE) | |
| range of heliocentric distances | 7.31 au – 5.33 au (perihelion) – 5.49 au | |
| detectability of NG effects in the comet's motion | NG effects not determinable | |
| type of model of motion | GR - gravitational orbit | |
| data weighting | YES | |
| number of residuals | 3216 | |
| RMS [arcseconds] | 0.45 | |
| orbit quality class | 1a+ | |
| orbital elements (barycentric ecliptic J2000) | ||
|---|---|---|
| Epoch | 2325 02 02 | |
| perihelion date | 2017 11 22.55889125 | ± 0.00028346 |
| perihelion distance [au] | 5.32987392 | ± 0.00000156 |
| eccentricity | 0.99931323 | ± 0.00000180 |
| argument of perihelion [°] | 10.189293 | ± 0.000030 |
| ascending node [°] | 128.129511 | ± 0.000003 |
| inclination [°] | 121.199333 | ± 0.000005 |
| reciprocal semi-major axis [10-6 au-1] | 128.85 | ± 0.34 |
| file containing 5001 VCs swarm |
|---|
| 2016a1a5.bpl |
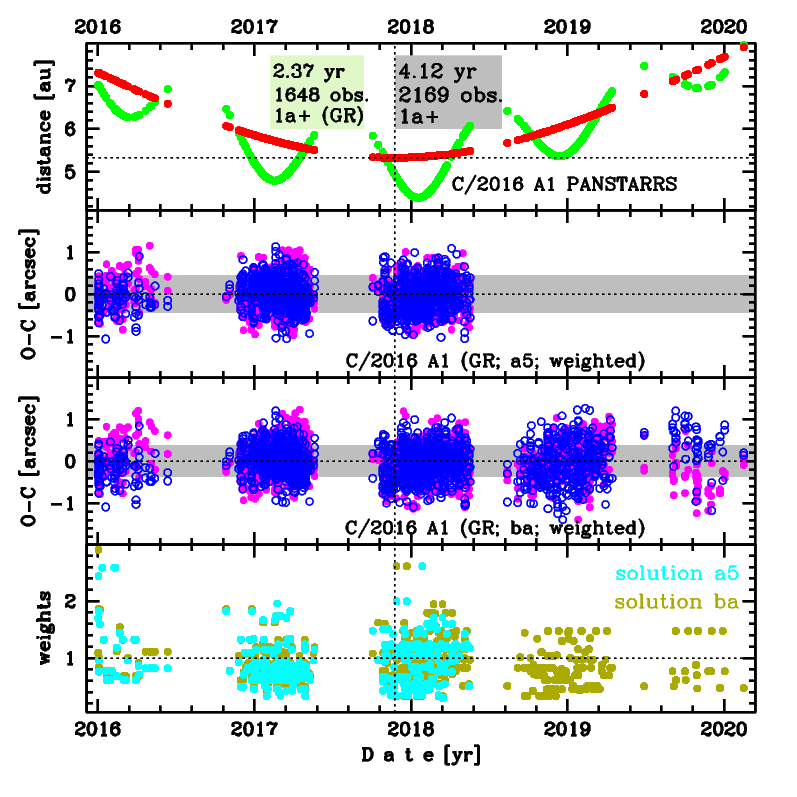
Upper panel: Time distribution of positional observations with corresponding heliocentric (red curve) and geocentric (green curve) distance at which they were taken. The horizontal dotted line shows the perihelion distance for a given comet whereas vertical dotted line — the moment of perihelion passage.
Middle panel(s): O-C diagram for a given solution (sometimes in comparison to another solution available in CODE), where residuals in right ascension are shown using magenta dots and in declination by blue open circles.
Lowest panel: Relative weights for a given data set(s).
Middle panel(s): O-C diagram for a given solution (sometimes in comparison to another solution available in CODE), where residuals in right ascension are shown using magenta dots and in declination by blue open circles.
Lowest panel: Relative weights for a given data set(s).
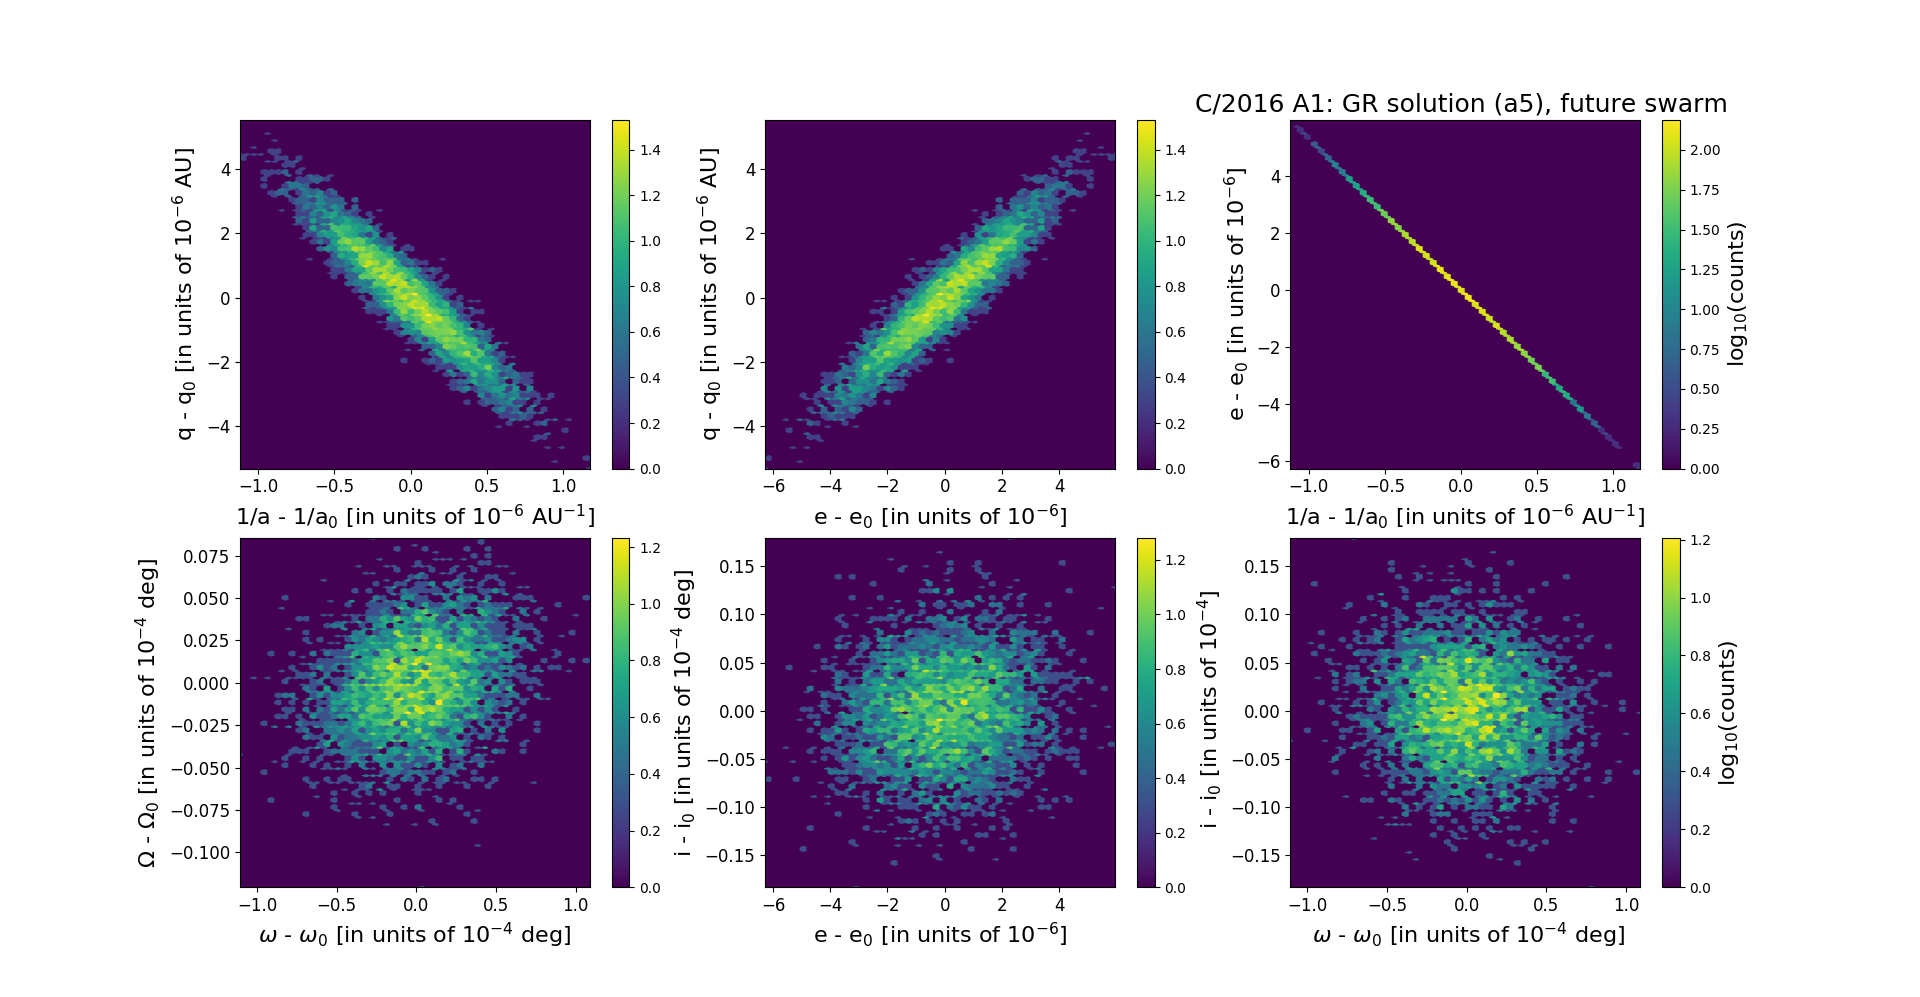
Six 2D-projections of the 6D space of future swarm including 5001 VCs. Each density map is given in logarithmic scale presented on the right in the individual panel.