C/2016 A1 PANSTARRS
more info
Comet C/2016 A1 was discovered on 1 January 2016 with Pan-STARRS 1 telescope (Haleakala), that is about almost 2 yr before its perihelion passage, and was next observed until 15 February 2020.
Comet had its closest approach to the Earth on 17 January 2018 (4.397 au); about 2 months after its perihelion passage.
Solutions given here are based on data spanning over 4.12 yr in a range of heliocentric distances: 7.31 au 5.328 au (perihelion) – 7.90 au.
This Oort spike comet suffers small planetary perturbations during its passage through the planetary system that lead to a more tight future orbit (see future barycentric orbit).
See also Królikowska and Dones 2023.
| solution description | ||
|---|---|---|
| number of observations | 1648 | |
| data interval | 2016 01 01 – 2018 05 17 | |
| data arc selection | data generally limited to pre-perihelion (PRE) | |
| range of heliocentric distances | 7.31 au – 5.33 au (perihelion) – 5.49 au | |
| detectability of NG effects in the comet's motion | NG effects not determinable | |
| type of model of motion | GR - gravitational orbit | |
| data weighting | YES | |
| number of residuals | 3216 | |
| RMS [arcseconds] | 0.45 | |
| orbit quality class | 1a+ | |
| next orbit statistics, both Galactic and stellar perturbations were taken into account | ||
|---|---|---|
| no. of returning VCs in the swarm | 5001 | * |
| no. of escaping VCs in the swarm | 0 | |
| no. of hyperbolas among escaping VCs in the swarm | 0 | |
| next reciprocal semi-major axis [10-6 au-1] | 128.43 – 128.87 – 129.31 | |
| next perihelion distance [au] | 5.34194 – 5.3423 – 5.34265 | |
| next aphelion distance [103 au] | 15.46 – 15.51 – 15.57 | |
| time interval to next perihelion [Myr] | 0.6793 – 0.6828 – 0.6863 | |
| percentage of VCs with qnext < 10 | 100 | |
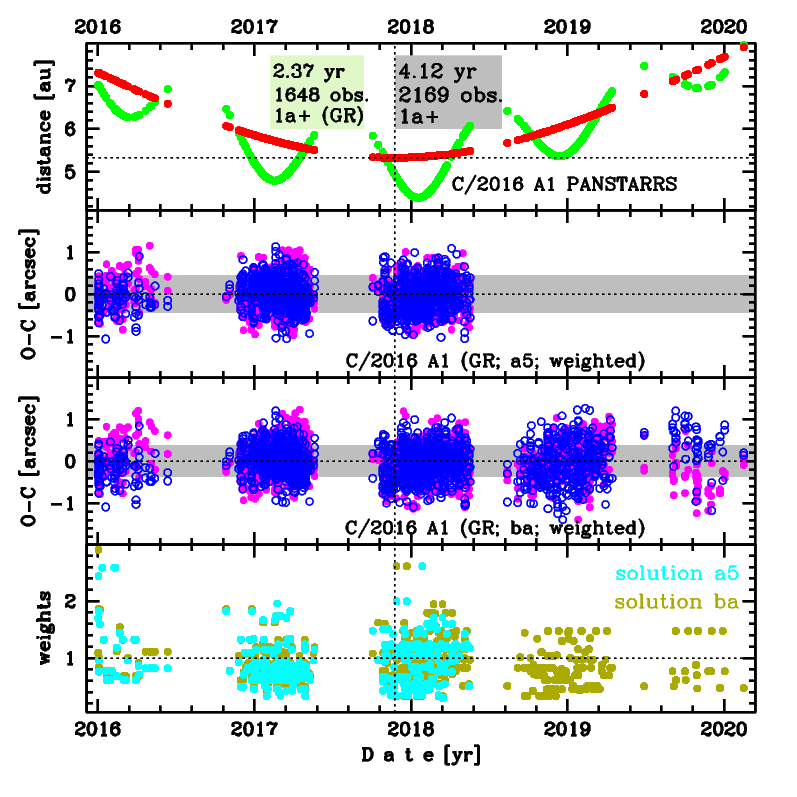
Upper panel: Time distribution of positional observations with corresponding heliocentric (red curve) and geocentric (green curve) distance at which they were taken. The horizontal dotted line shows the perihelion distance for a given comet whereas vertical dotted line — the moment of perihelion passage.
Middle panel(s): O-C diagram for a given solution (sometimes in comparison to another solution available in CODE), where residuals in right ascension are shown using magenta dots and in declination by blue open circles.
Lowest panel: Relative weights for a given data set(s).
Middle panel(s): O-C diagram for a given solution (sometimes in comparison to another solution available in CODE), where residuals in right ascension are shown using magenta dots and in declination by blue open circles.
Lowest panel: Relative weights for a given data set(s).
| next_g orbit statistics, here only the Galactic tide has been included | ||
|---|---|---|
| no. of returning VCs in the swarm | 5001 | * |
| no. of escaping VCs in the swarm | 0 | |
| no. of hyperbolas among escaping VCs in the swarm | 0 | |
| next reciprocal semi-major axis [10-6 au-1] | 128.42 – 128.85 – 129.29 | |
| next perihelion distance [au] | 5.35748 – 5.35784 – 5.35819 | |
| next aphelion distance [103 au] | 15.46 – 15.52 – 15.57 | |
| time interval to next perihelion [Myr] | 0.6794 – 0.6829 – 0.6864 | |
| percentage of VCs with qnext < 10 | 100 | |